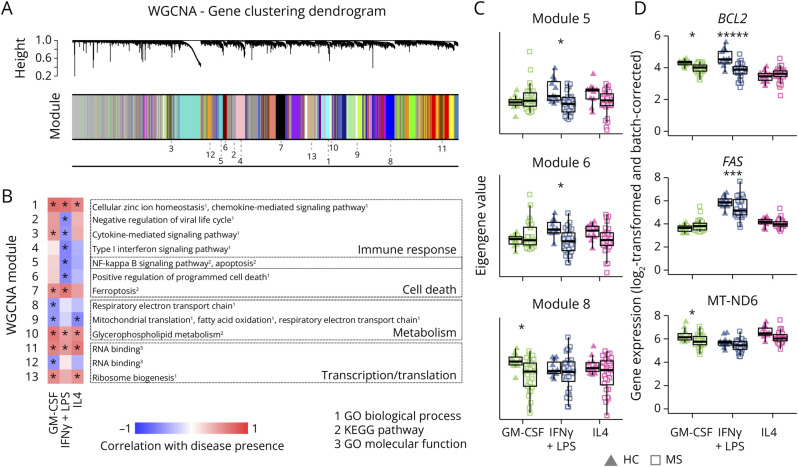
Figure 5. Modules of Coexpressed Genes Involved in Inflammatory and Metabolic Pathways Show Altered Expression in MS Macrophages Compared With HC Macrophages.
(A) Clustering of genes in the multidataset WGCNA, with module assignment indicated as follows. The multidataset network was produced by comparing correlations between genes for each state individually and basing clustering on the maximum correlation for each gene pair. (B) Heatmap of correlation between presence of disease and eigengene values of each module and set of stimuli. Only modules with significant correlation and functional annotation terms are shown. Functional annotations were given by Enrichr from databases GO biological process, GO molecular function, and KEGG pathways (adjusted p < 0.05). (C) Eigengene values in 3 modules, for each sample and module, grouped according to disease (HC: triangles; MS: squares) and activation states (GM-CSF: green; IFNγ+LPS: blue; IL4: pink). (D) Expression of examples of genes from each module shown in C (grouped and visualized as in C, HC = healthy controls [n = 11]; MS = patients with MS [n = 28]). *p < 0.05. Correlations were calculated with FDR-corrected default WGCNA functions (B and C), and differential expression was tested with limma D.

