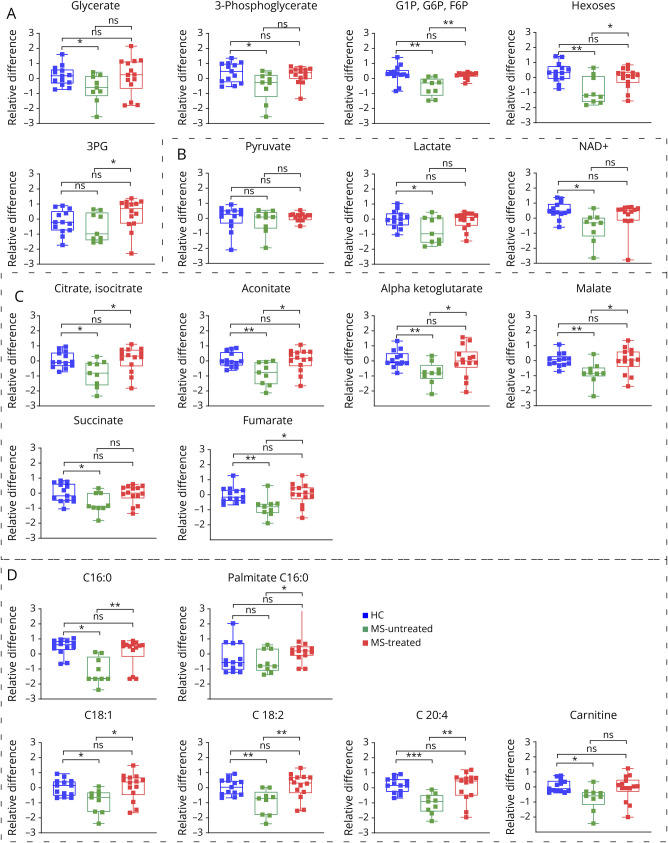
Figure 6. Boxplots of Abundance of Metabolites in HCs and MS.
HC = healthy controls (blue triangle); MS = patients with MS (untreated: green squares, treated: red squares); G1P = glucose-1-phosphate; G6P = glucose-6-phosphate; 3 PG = 3-phosphoglyceric acid. Boxes highlight metabolites implicated, respectively, in (A) glycolysis, (C) TCA cycle, and (D) fatty acid oxidation. *p < 0.05, **p < 0.01, and ***p < 0.001 in the Mann-Whitney U test.

