
Figure 1.
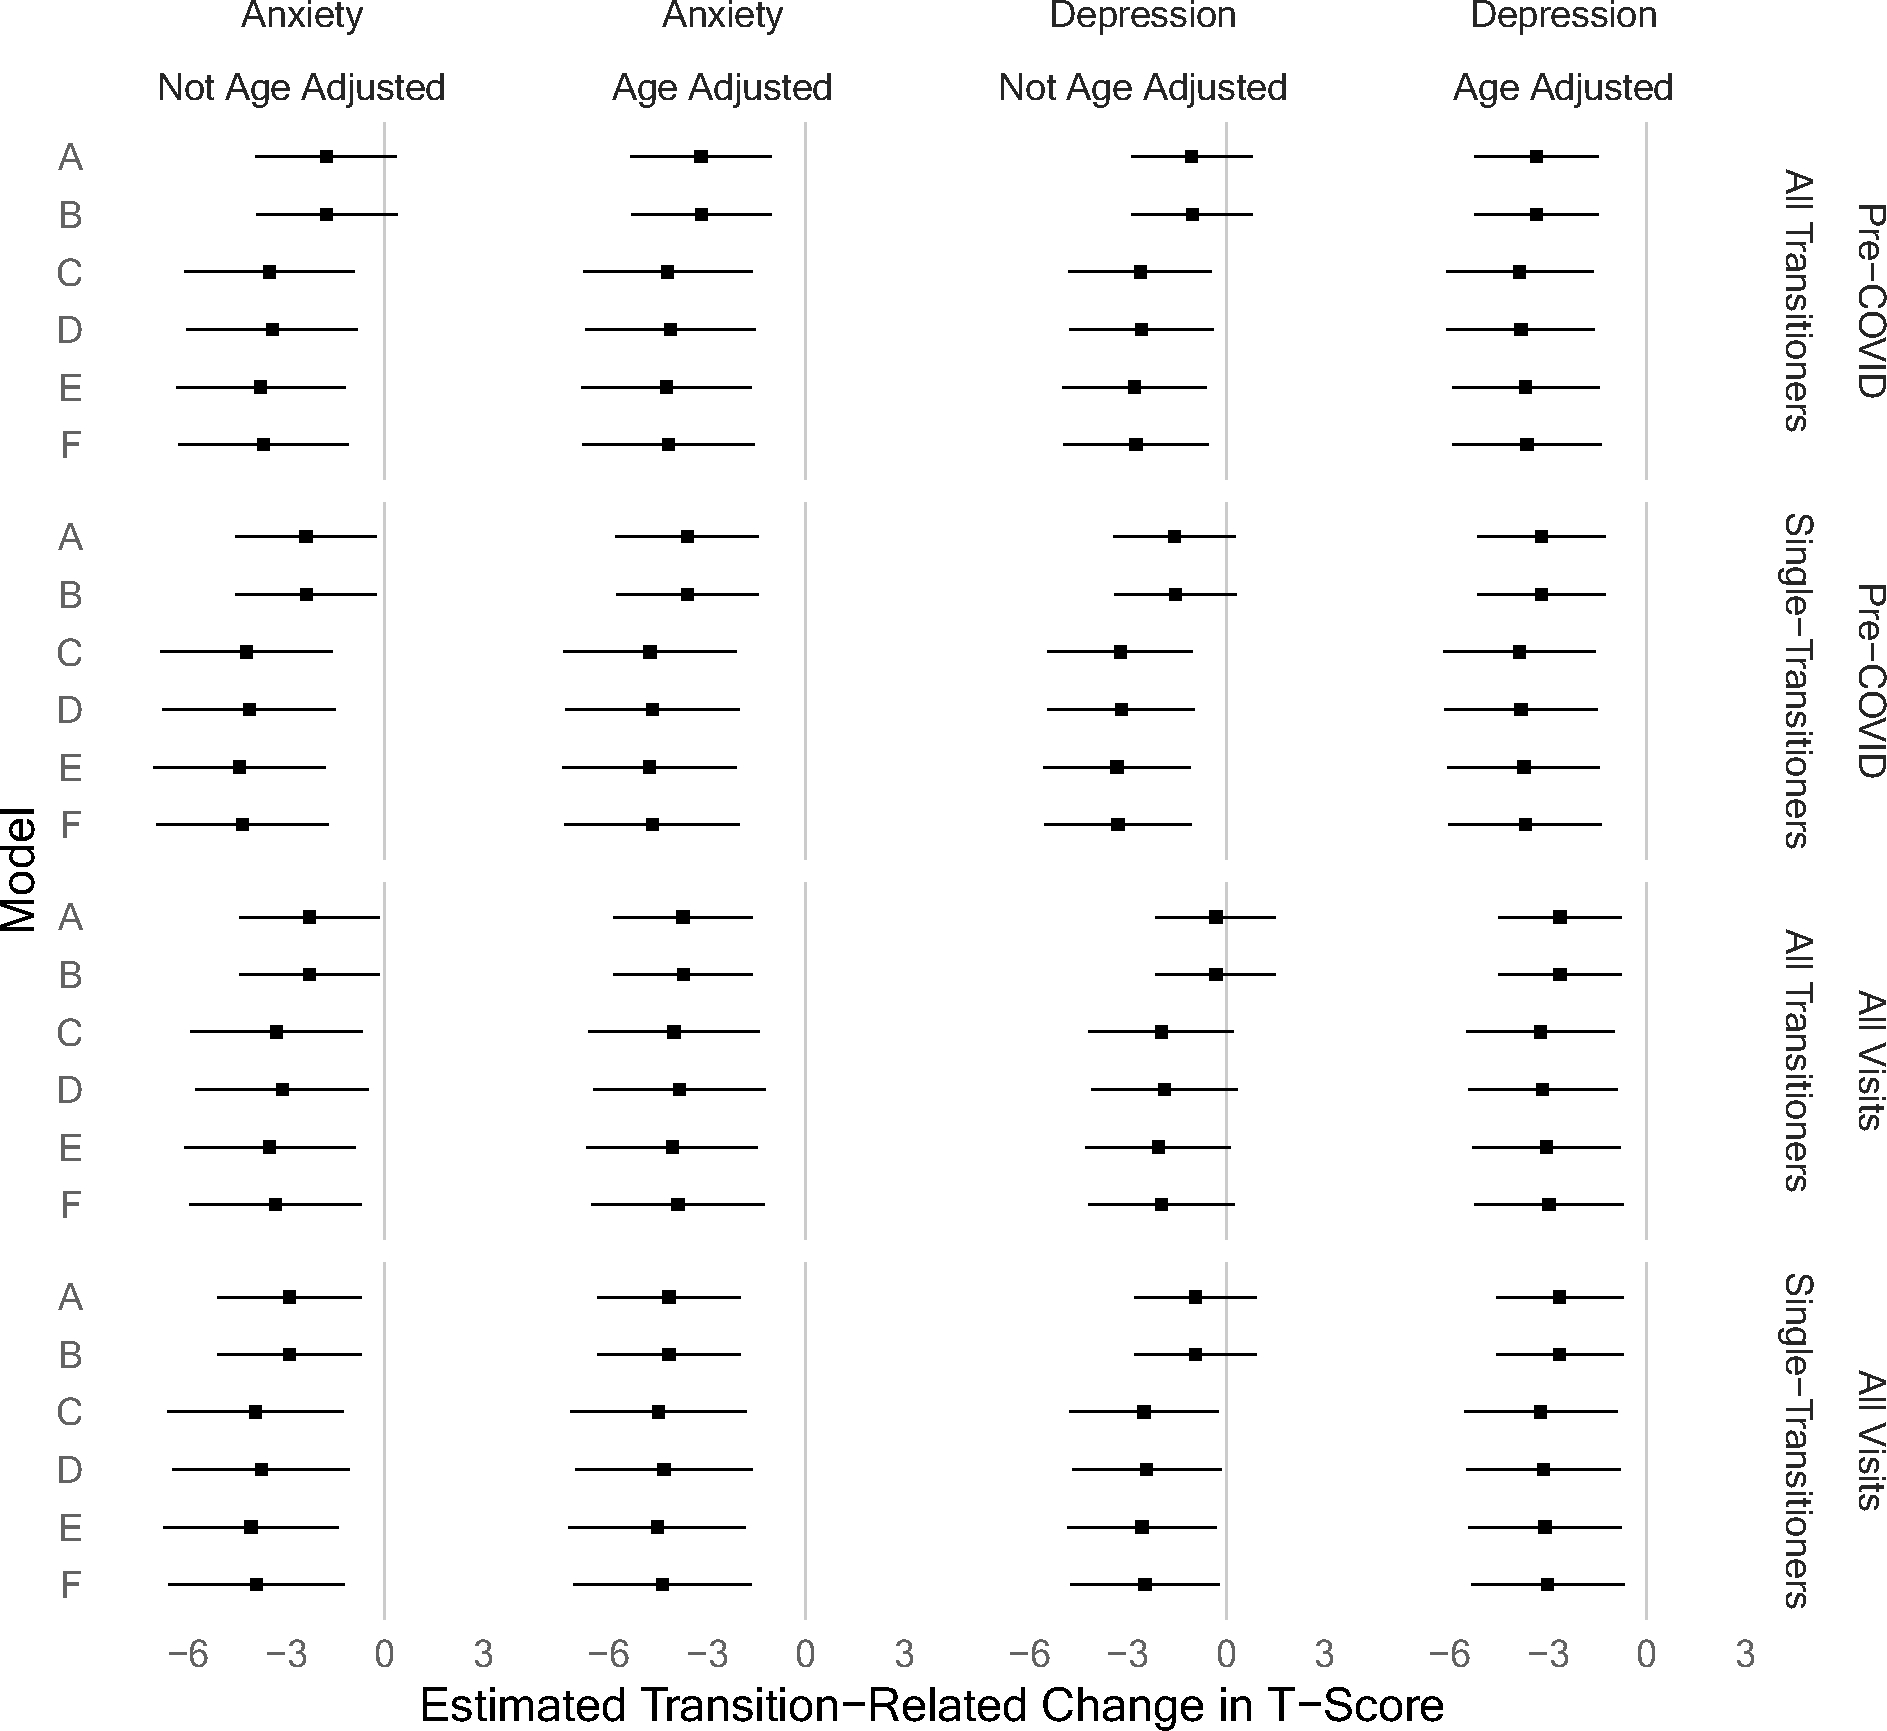
Forest Plot of Transition-Related Mental Health Change Estimates. In each graph, the dot represents the point estimate of mental health change between pre-transition and post-transition visits. The error bars represent confidence intervals (calculated using the Satterthwaite method); error bars that do not overlap with zero show significant effects. Across a variety of analytic approaches, we see that anxiety and depression are improved (46 out of 48 analyses for anxiety; 36 out of 48 analyses for depression) or unchanged (2 out of 48 analyses for anxiety; 12 out of 48 analyses for depression) after transition relative to before transition. We saw no analytic conditions under which post-transition mental health was worse than pre-transition mental health.