
Figure 3.
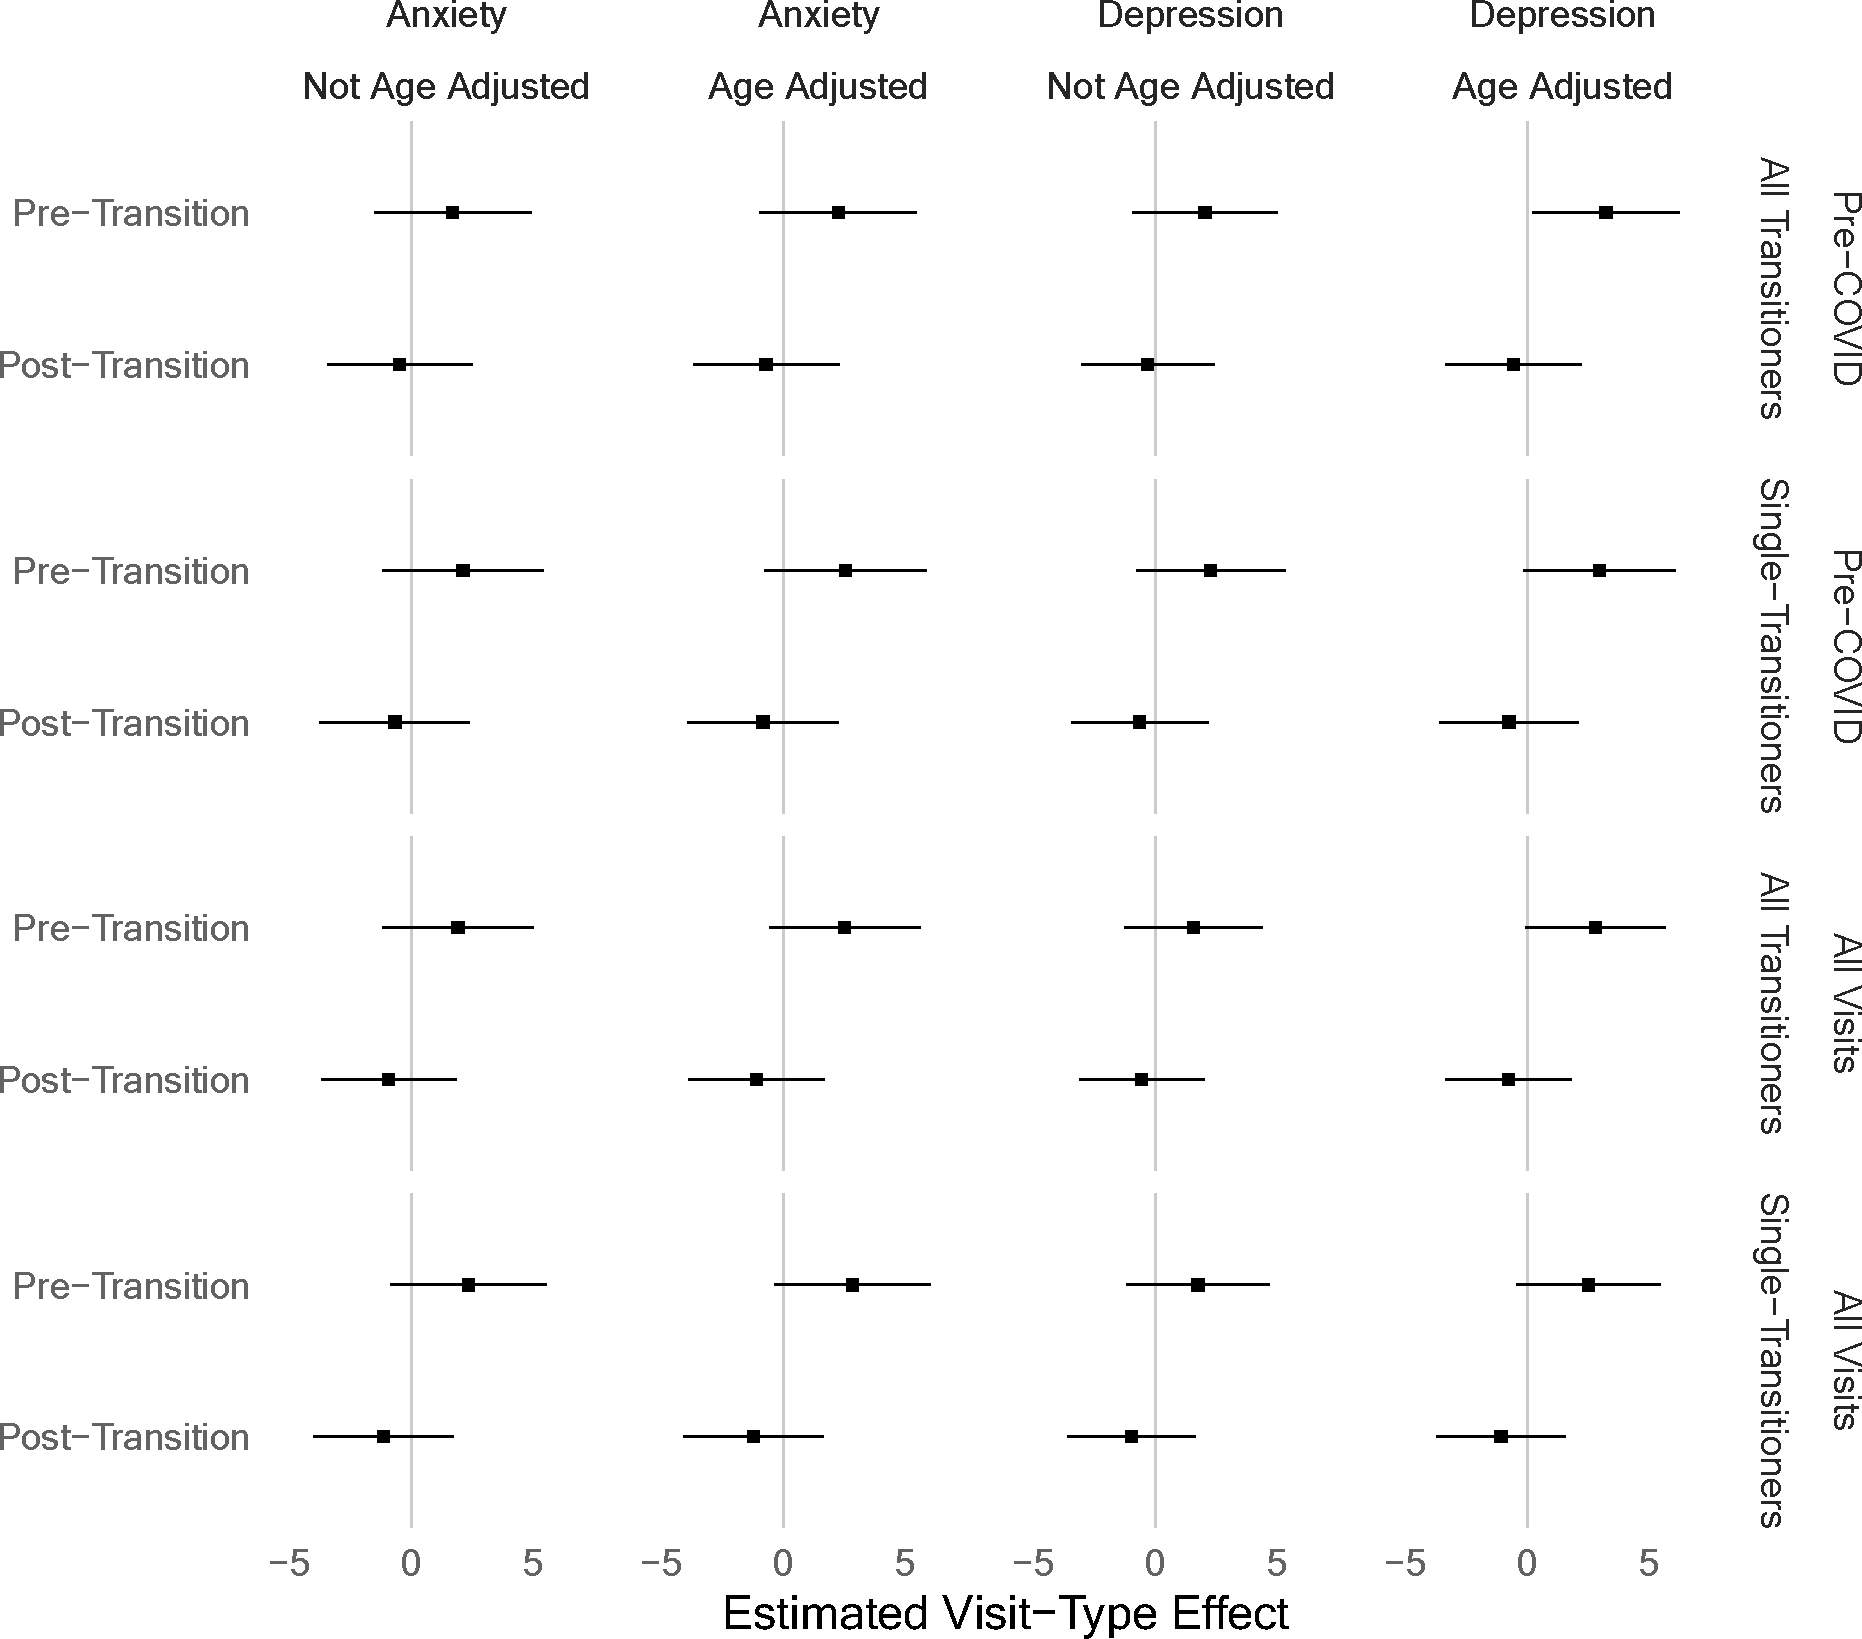
Forest Plot of Visit-Type Mental Health Difference Estimates. In each graph, we see two effects: one comparing pre-transition transitioners with non-transitioners and one comparing post-transition transitioners with non-transitioners. Each point estimate is shown, along with confidence intervals (calculated using the Satterthwaite method); error bars that do not overlap with zero show statistically significant effects. Positive values indicate that the transitioners had mental health decrements relative to the non-transitioners, while negative values indicate that the transitioners had mental health benefits relative to the non-transitioners. All effects are from analyses controlling for age, to account for age differences between groups. In 31 of 32 cases, the transitioners do not differ significantly from the non-transitioners (regardless of transition status). We additionally note that the consistent pattern in which pre-transition estimates are negative and post-transition estimates are positive is consistent with our main finding that social transition is associated with mental health improvements.