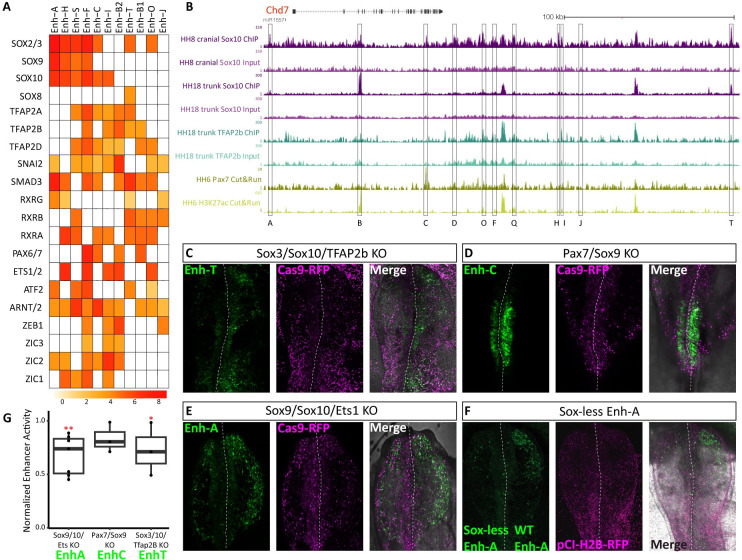
Fig 4. Upstream transcription factors controlling Chd7 enhancer activity.
(A) Heatmap showing predicted TF binding motifs within chick Chd7 enhancers. (B) Tracks from UCSC genome browser showing biotin-ChIP data for Sox10 (purple), Tfap2B (teal), Pax7 (yellow), and H3K27ac. (C–E) Chicken embryos showing indicated enhancer activity (GFP) and Cas9 (RFP) following bilateral electroporation of Cas9 and guide RNAs targeting selected TFs on the left (experimental) and scrambled guide RNA with Cas9 on the right (control). (F) Chicken embryo bilaterally electroporated with a construct containing enh-A where all the Sox sites have been mutated on the left and wild-type enh-A construct on the right, both driving GFP expression. pCI-H2B-RFP was co-electroporated on both sides as a control. (G) Loss of enhancer activity (GFP intensity) following TF knockout experiments in (C–E) was quantified left versus right, relative to control RFP intensity, two-tailed paired T test, enh-A; p = 0.023**, n = 7 embryos, enh-C; p = 0.114, ns n = 3, enh-T; p = 0.047*, n = 4. TF, transcription factor.

