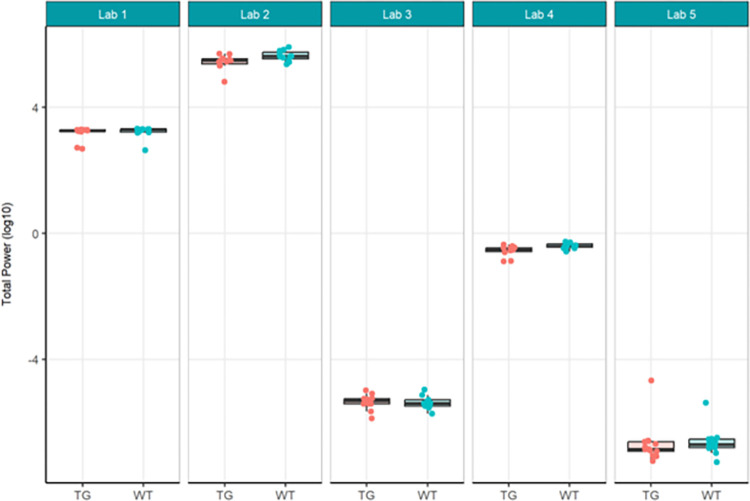
Fig 1. Localisation phase total power analysed locally by the partners.
Tukey boxplots and individual data points for the log10 total power values per genotype group for each participating laboratory during phase 1. Lab 2 and Lab 4 found significant reduction in total power in Tg4510 mice compared to WT controls (see S4 Table).

