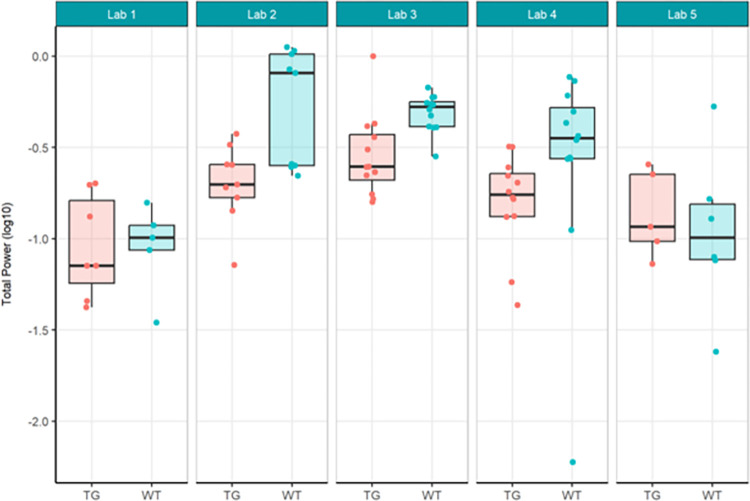
Fig 6. Harmonisation phase total power analysed locally by the partners.
Tukey boxplots and individual data points for the log10 total power values per genotype group and every participating laboratory during phase 2 data collections. Lab 2 and Lab 3 found a significant decrease in total power in Tg4510 mice compared to WT controls (see S6 Table). The boxplot displays individual data points, as well as the median, the first (Q1) and third (Q3) quartiles and the whiskers are based on the interquartile range (IQR; Q3 –Q1) where they are not higher than Q3 + 1.5 * IQR and lower than Q1–1.5 * IQR.

