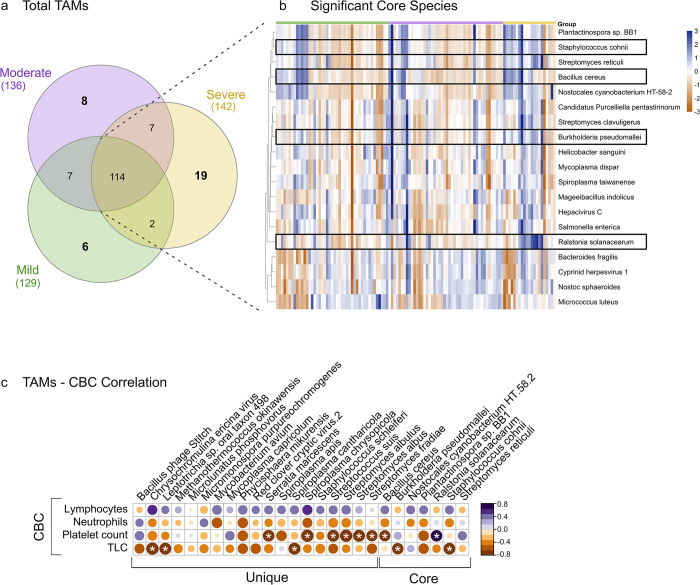
Fig 4. Microbial species profile across mild, moderate, and severe dengue patients.
(a) Spectrum of microbial species observed across the mild, moderate, and severe Dengue patients. (b) The 19 significant core TAMs that differentiate across the severity groups are shown as a heatmap. Box highlights the opportunistic TAMs, significantly abundant in the severe patients. (c) Correlation matrix between common and unique TAMs and significant CBC parameters. Significant correlations are highlighted by white stars.

