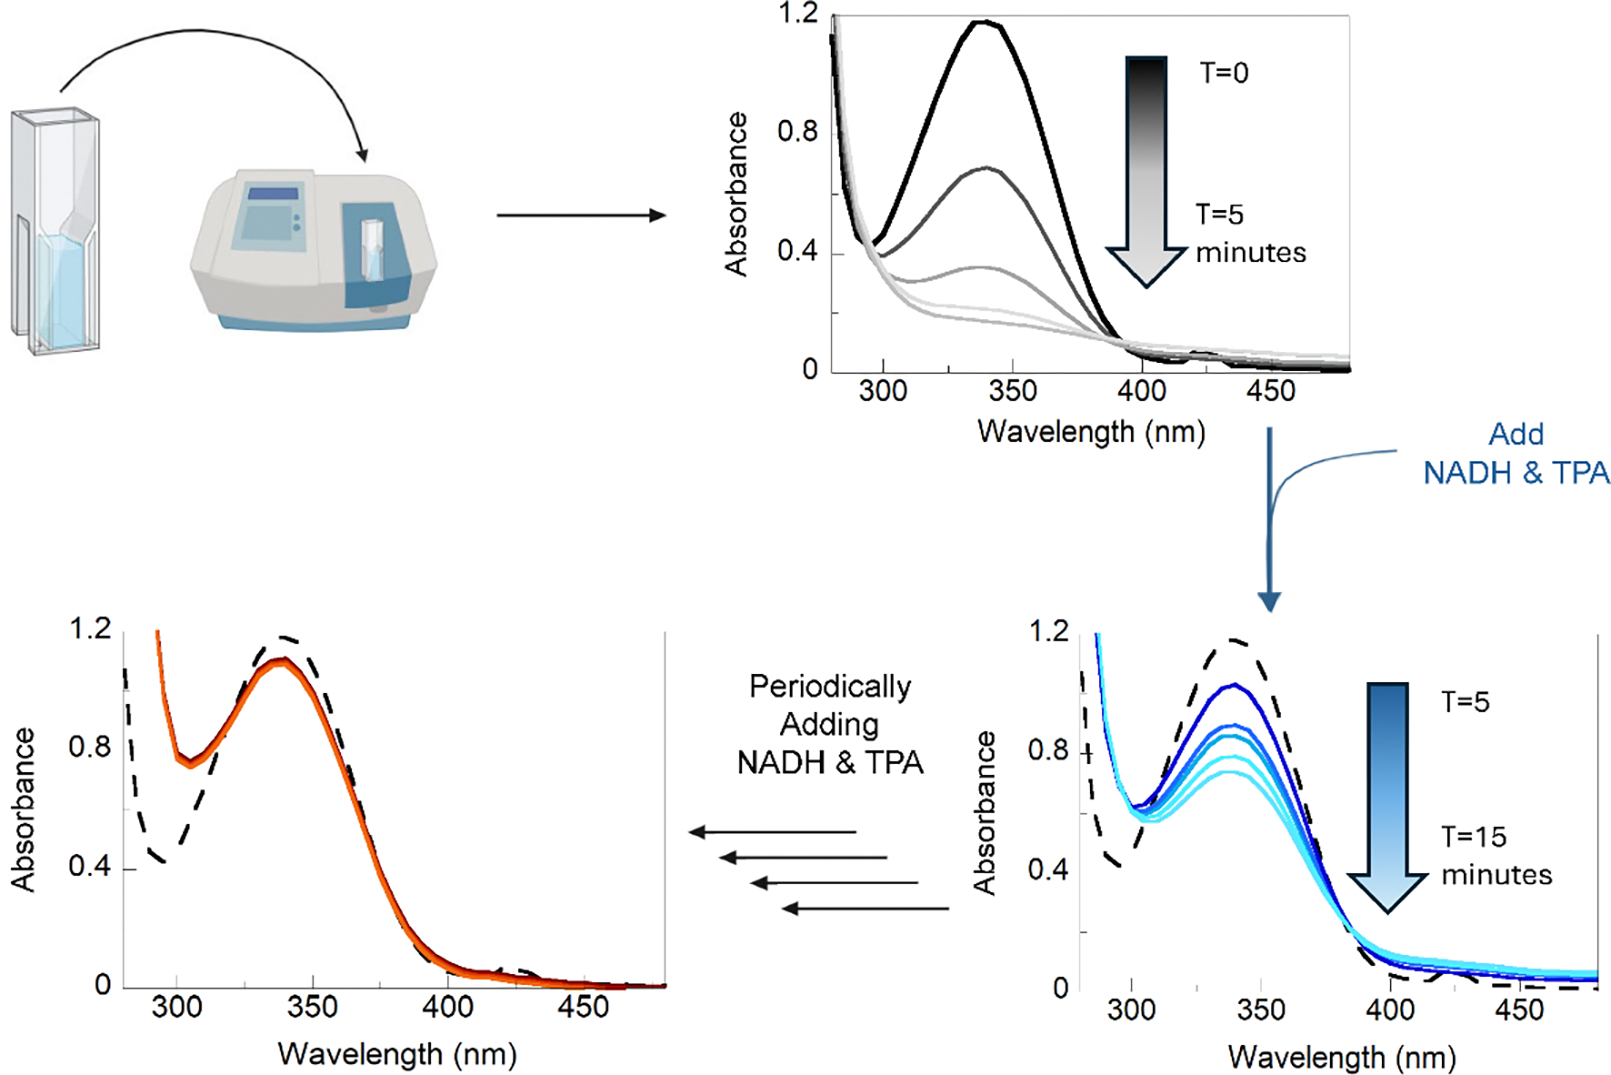
Figure 6.

UV-Visible analysis of enzyme lifetime. Function of the RO system is monitored by decrease of signal at the λmax = 340 nm. The reaction containing TPADO, TPARED, and buffer was initiated by addition of 100 μM NADH and TPA. After 5 minutes of continuous measurements, decreased absorbance at 340 nm indicated that the NADH had been consumed, as shown by the black absorbance spectrum. NADH and TPA were then added again in 100 μM increments, as indicated by the blue absorbance spectrum, until no further consumption of NADH was monitored after regeneration (red spectrum).
