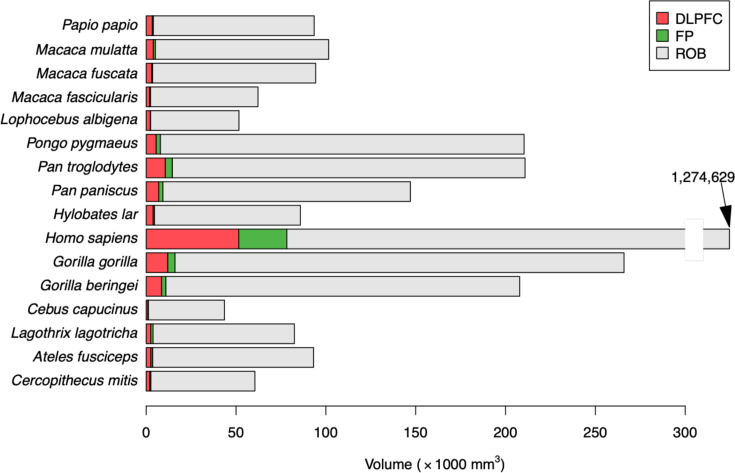
Figure 3. Average values of the three regions of interest.
Each line provides the cumulated volumes of the dorso-lateral prefrontal cortex (DLPFC, green), the frontal pole (FP, gray), and the rest of the brain (ROB, blue), such that the size of each bar represents the whole brain volume. Note: for Homo sapiens, the bar has been truncated, since its value was out of scale with the other species.

