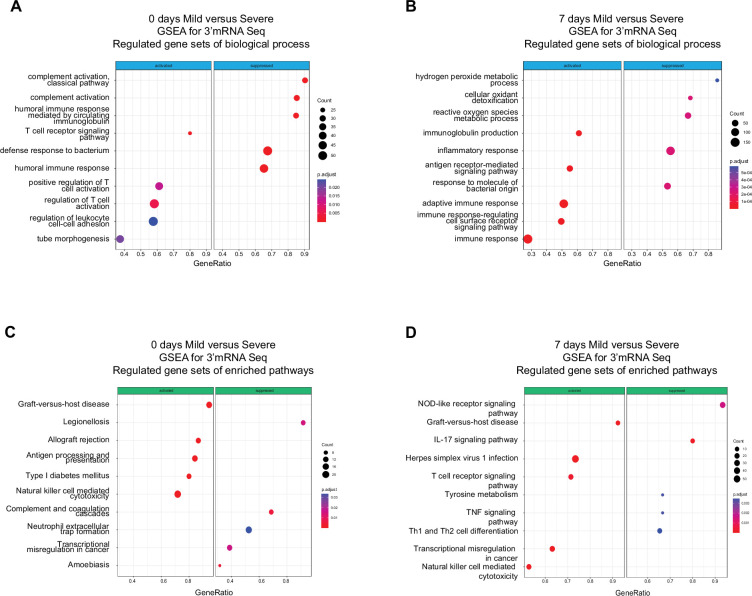
Figure 2. Gene set enrichment analysis (GSEA) shows biological processes and enriched pathways associated to innate and adaptive immune response after severe acute respiratory syndrome coronavirus 2 (SARS-CoV-2) infection.
(A, B) Bubble plots show the biological processes (BP) of enriched genes for differentially expressed genes (DEGs) between mild and severe for D0 and D7 after recruitment, respectively. (C, D) Bubble plots show the Kyoto encyclopedia of gene and genomes (KEGG) enriched pathways of enriched genes for DEGs between mild and severe for D0 and D7, respectively. The Count (black circles) represents the number of genes included on each set. Generatio is the ratio between number of genes found in the set and total genes of set. The scale-color bar indicates the p-adjustment of each BP or KEGG pathway.

