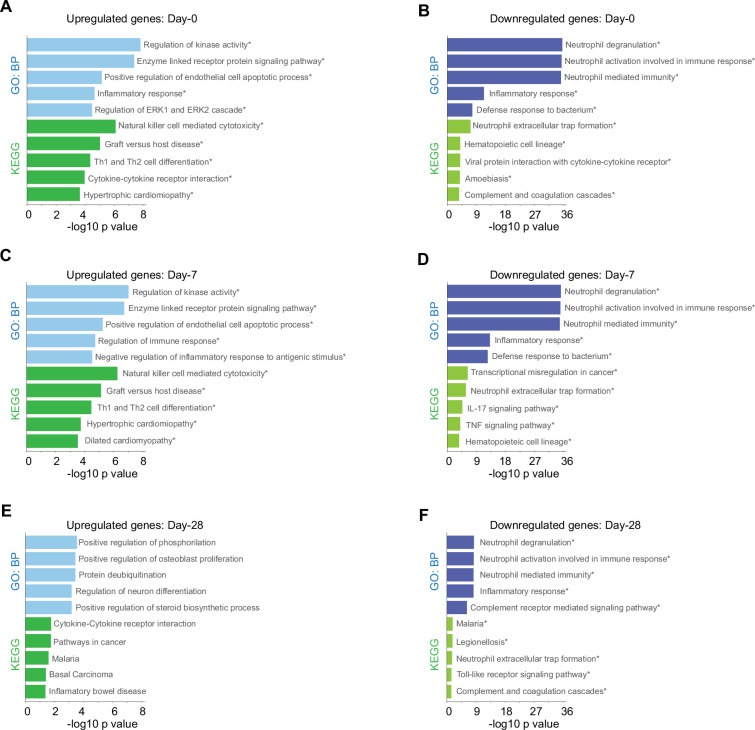
Figure 3. Biological processes and Kyoto encyclopedia of gene and genomes (KEGG) pathway for genes with differential expression levels over time in mild versus severe patients.
Bar plots show gene ontology analysis for biological processes in light-blue/dark-blue and KEGG pathway in light-green/dark-green, using upregulated genes (A, C, E) and downregulated genes (B, D, F). The size of each bar is according to its −log10 p-value, and name pathways with asterisk indicates a q-value ≤0.05.

