. 2024 Oct 29;13:RP94242. doi: 10.7554/eLife.94242

Figure 4. Gene function network for natural killer (NK) cell hub-genes with differential expression levels between mild and severe patients during acute phase of COVID-19.

(A) Kyoto encyclopedia of gene and genomes (KEGG) pathway of NK cell-mediated cytotoxicity represents the set NK cell hub-genes upregulated (red-boxes) in mild versus severe patients. The green boxes correspond to genes without differential expression. (B) Heatmap shows the differential expression levels of NK cell hub-genes over time (D0, D7, and D28 after recruitment) separated by mild and severe groups. The expression levels are represented by the z-score of normalized counts. Dendrogram shows the hierarchical clustering of genes. (C) Protein–protein interaction (PPI) network for upregulated genes during the acute phase in mild patients. The network corresponds to the principal clusters with more interaction between proteins and highlights the three most represented pathways: Cytokine–cytokine receptor interaction (blue); NK cell-mediated cytotoxicity (red); and Th1 and Th2 cell differentiation (yellow). (D) Time course expression levels for the main protein nodes identified in PPI network during the acute phase of COVID-19. The trajectories of these genes are graphed as days after recruitment (D0, D7, and D28) for mild (red triangle) and severe (green circle) groups and their enrichment is represented by the z-score of normalized counts.

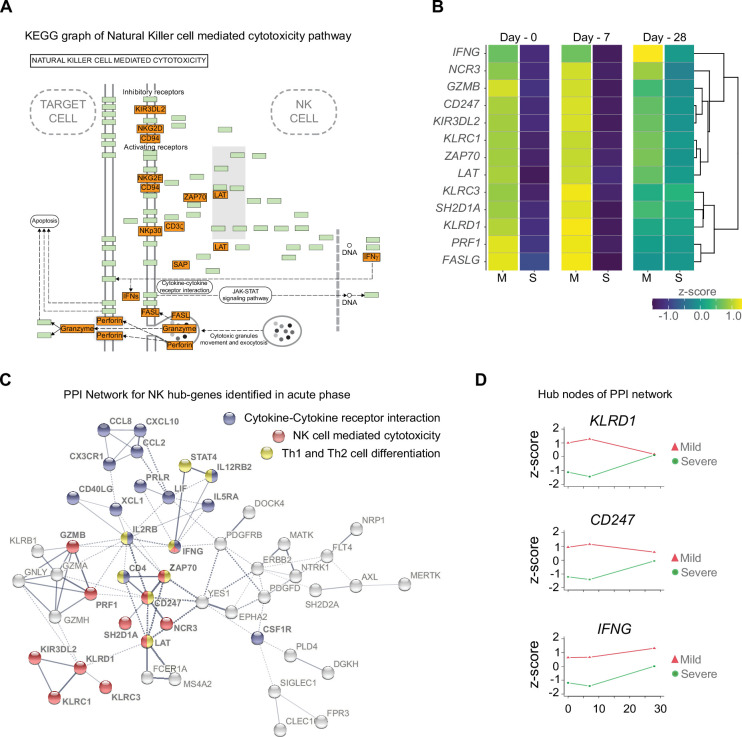
Figure 4—source data 1. Kyoto encyclopedia of gene and genomes (KEGG) graph shows genes with differential expression found in the pairwise comparison (D0 vs D7) from natural killer cell-mediated cytotoxicity pathway for upregulated genes in mild COVID-19 patients at D0 (A) and D7 (B), from Th1 and Th2 cell differentiation pathway at D0 (C) and D7 (D), and from cytokine–cytokine receptor interaction pathway at D0 (E).
Red boxes depict upregulated genes, whereas green boxes depict genes without significant differential gene expression within each KEGG pathway.

Figure 4.

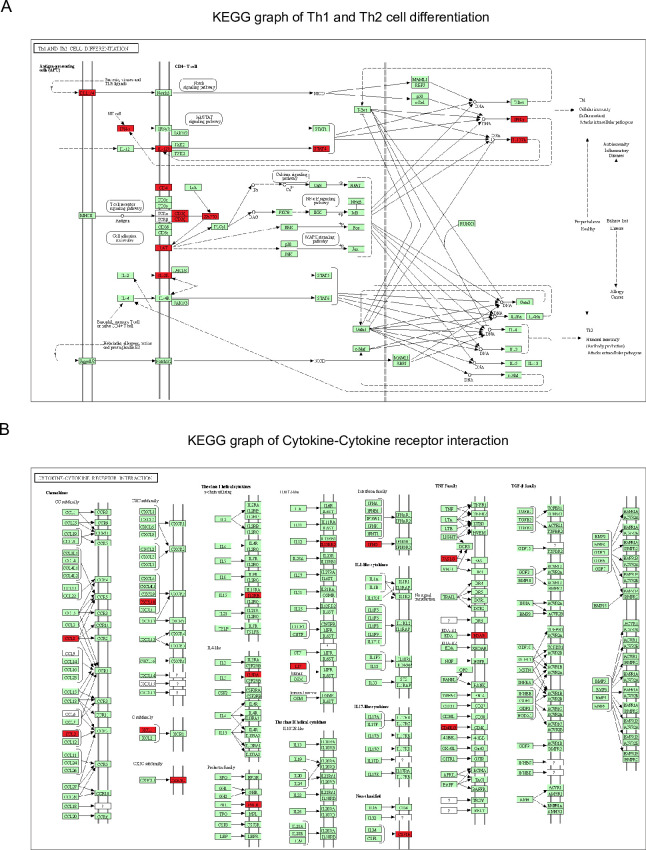
Figure 4—figure supplement 1. Kyoto encyclopedia of gene and genomes (KEGG) graphs show genes differentially expressed over time of the Th1 and Th2 cell differentiation pathway (A) and the cytokine–cytokine receptor interaction pathway (B).

Figure 4—figure supplement 1.

Red boxes depict upregulated genes in mild COVID-19 patients during the acute phase of the disease, whereas green boxes depict genes without significant differential gene expression within the KEGG pathways.
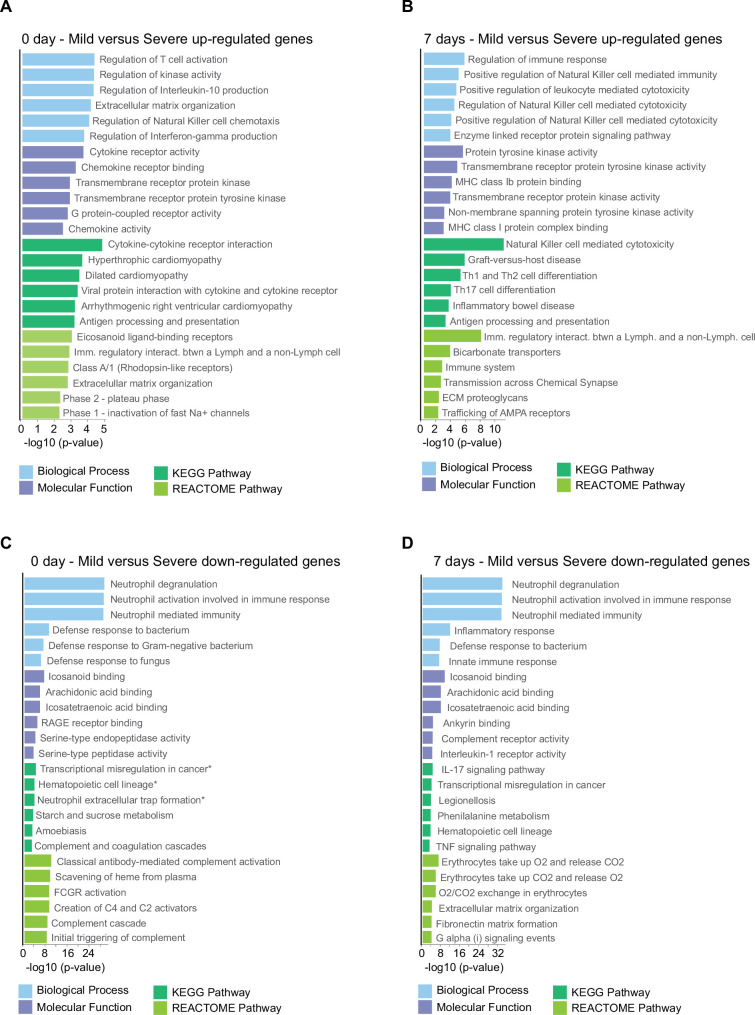
Figure 4—figure supplement 2. Gene ontology (GO) and Kyoto encyclopedia of gene and genomes (KEGG) and REACTOME pathway analyses of differentially expressed genes (DEGs) found in the pairwise comparison between D0 and D7 of COVID-19 infection.

Figure 4—figure supplement 2.

Bar graphs showing the enrichment of GO biological processes (in blue color), GO molecular functions (in purple color), KEGG pathways (in dark green color), and Reactome pathways (in light green color) between mild and severe COVID-19 patients. Enrichment results are sorted by −log10(p-value) (higher on top) with a cut-off for DEGs ≥4 fold-change considering the upregulated genes at D0 (A), upregulated genes at D7 (B), downregulated genes at D0 (C), and downregulated genes at D7 (D).
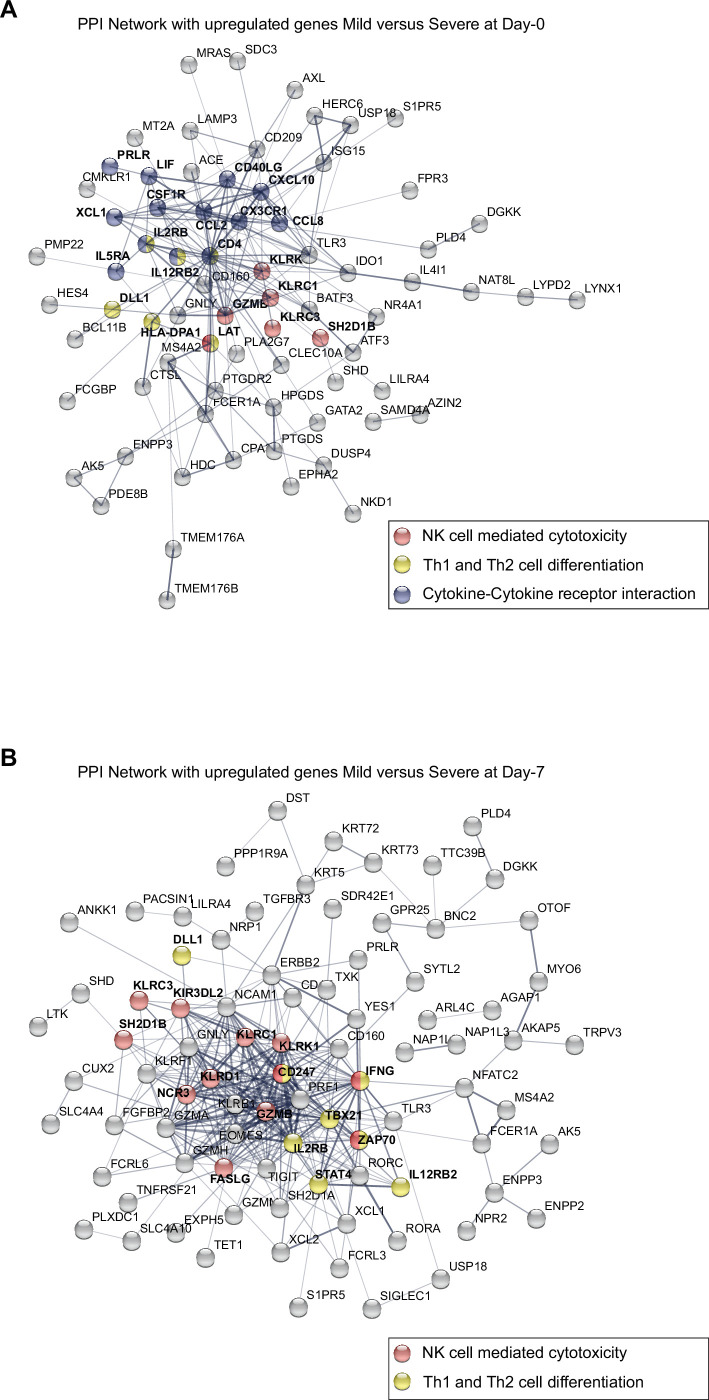
Figure 4—figure supplement 3. Protein–protein interaction (PPI) network graphs show the upregulated genes found in the pairwise comparison (D0 and D7) in mild versus severe COVID-19 patients.

Figure 4—figure supplement 3.

(A) Topological representation of the PPI network of upregulated genes in mild patients on D0. (B) Topological representation of the PPI network of upregulated genes in mild patients on D7. Some nodes are color-coded to highlight proteins involved in the following pathways: Cytokine–cytokine receptor interaction (blue), natural killer (NK) cell-mediated cytotoxicity (red); and Th1 and Th2 cell differentiation (yellow).
Figure 4—figure supplement 4. Gene ontology (GO) and networks of enriched pathway analyses of differentially expressed genes (DEGs) found in the pairwise comparison between D7 of mild patients and D0 of severe patients with COVID-19.

Figure 4—figure supplement 4.

Bar graphs show the enrichment of GO terms for biological processes while the networks reveal Kyoto encyclopedia of gene and genomes (KEGG) enriched pathways for upregulated genes (A, B) and downregulated genes (C, D) in mild patients, respectively. The size of each bar is according to its −log10 p-value, and name GO terms with asterisk indicates a q-value ≤0.05.