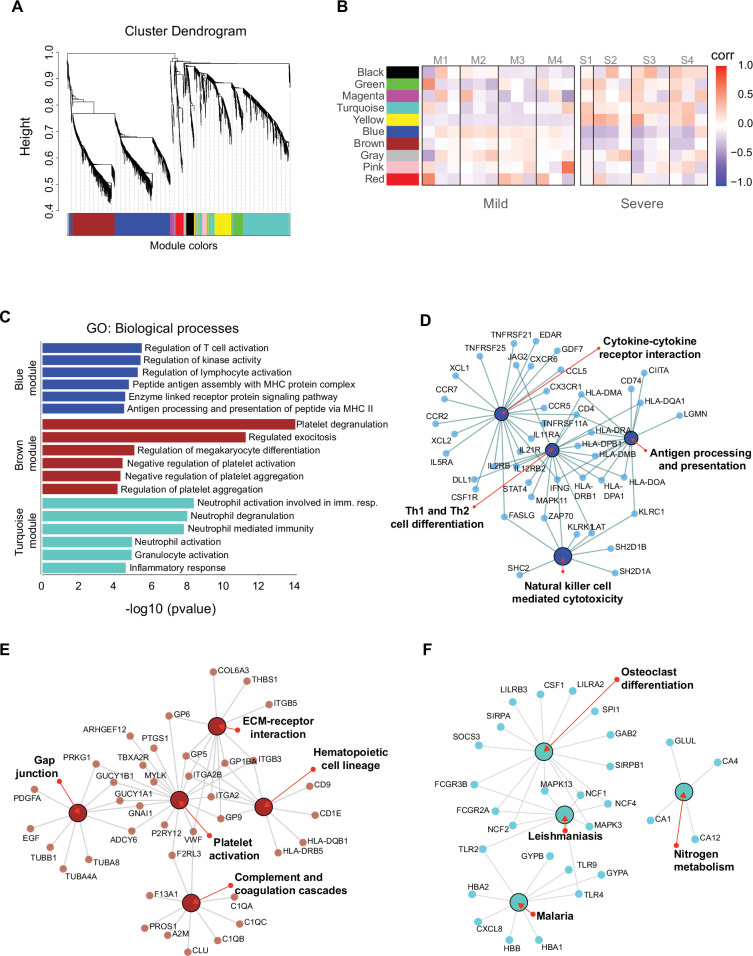
Figure 5. Gene co-expression network analysis among the longitudinal transcriptomic profiling.
(A) Gene hierarchical clustering dendrogram of 10 detected modules based on Topological Overlap Matrices (TOM) measure. The branches and color bands represent the assigned module. (B) Module–trait relationships (MTRs) between detected modules and disease severity of COVID-19. MTRs are obtained by calculating Pearson correlation between the traits and the module eigengenes. The red and blue colors indicate strong positive or negative correlations, respectively. Rows represent module eigengene (ME) and columns indicate the disease severity of COVID-19, where correlations from each patient are shown from left to right according to their sampling time (D0, D7, and D28). (C) Gene ontology (GO) enrichment analysis of genes in the blue, brown, and turquoise modules. The color in the bar graphs refers to the module eigengene (ME). Enrichment results are sorted by −log10(p-value) (higher on top) of each biological process GO term. (D–F) Network visualization of enriched pathways based on co-expression genes from blue, brown, and turquoise modules, respectively.


