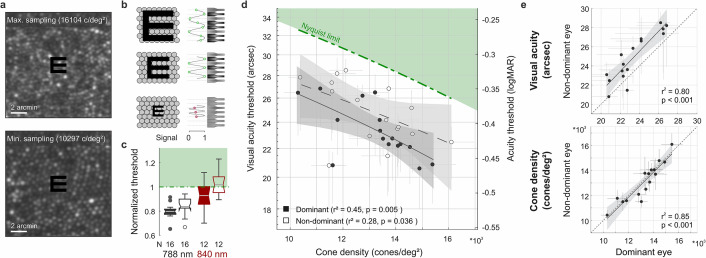
Figure 2. Visual acuity depends on foveolar sampling capacity.
(a) Foveolar cone mosaics of the two eyes with highest and lowest cone densities, overlayed with the physical stimulus at an average threshold size (24 arcsec). (b) Nyquist limit: critical details equaling or larger than the spacing of cones are resolvable. (c) Visual acuity thresholds measured with 788 or 840 nm infrared light, normalized to the eyes’ Nyquist limits. (d) Correlation between participant’s individual visual acuity thresholds and cone density. Thresholds exceeded the Nyquist sampling limit and were significantly lower in eyes with higher cone densities. Dominant eyes are shown as filled, and non-dominant eyes as open markers. The gray horizontal and vertical bars at each point represent standard deviations of sampling cone density and the 95% confidence intervals for acuity thresholds. The theoretical Nyquist limit is represented by a dashed green line. (e) Correlation between dominant and non-dominant eyes in visual acuity (top) and cone density (bottom). Dominant eyes reached, on average, 1.5 arcmin lower thresholds than non-dominant eyes, whereas cone density (at the retinal locations that sampled the stimulus) was very similar between fellow eyes.

