. 2024 Oct 29;13:RP98648. doi: 10.7554/eLife.98648

Figure 4. Drift moves stimuli to higher cone density areas.

(a) Five exemplary motion traces relative to cone density centroid (CDC), preferred retinal locus (PRL), and peak cone density (PCD) location on the Voronoi tessellated cone mosaic of one participant. (b) All single trial motion traces of one eye are shown on the corresponding cone mosaic (95 trials containing drift only). One-SD isoline areas (ISOA) are shown for all stimulus onset (blue) and offset (yellow) locations, indicating a trend of directional drift towards higher cone densities during 500 ms stimulus presentation. (c) Polar histogram of all individual motion traces (n=2739) shows the relative frequency of motion angles, θRetina, between the start (coordinate center) and end of motion in retinal coordinates. The inset indicates θ sign. (d) Same data as in c, where θCDC was computed relative to the line connecting drift start location and CDC, see inset. The pink quarter indicates the angular space used for the computation of the tuning ratio. For more details on the drift directionality of individual eyes, see Figure 1. (e) The difference between the acuity threshold and Nyquist limit showed a significant trend to be larger for stronger directionality tuning. The tuning ratio was computed as the ratio between the relative frequency of intra-participant drift motion towards the CDC (±45 deg) and the average of drift motion towards the remaining three quadrants. (f) Relative frequency of drift direction relative to CDC (top), PRL (middle), and PCD (bottom), respectively. For more details on the temporal progression of drift directionality, see Figure 2. (g) Across all participants and trials, drift length correlated with stimulus onset distance from CDC. There was no clear effect of stimulus onset distance on motion directionality (data color corresponding to θCDC). (h) The achieved sampling gain due to the performed drift motion is significantly correlated to the potential sampling gain in individuals. In both dominant and non-dominant eyes the potential sampling gain is on average exploited by 30%, respectively. Due to shifting the CDC towards the stimulus, participants had different PRLs for a sustained fixation task and the visual resolution task (see Figure 3).

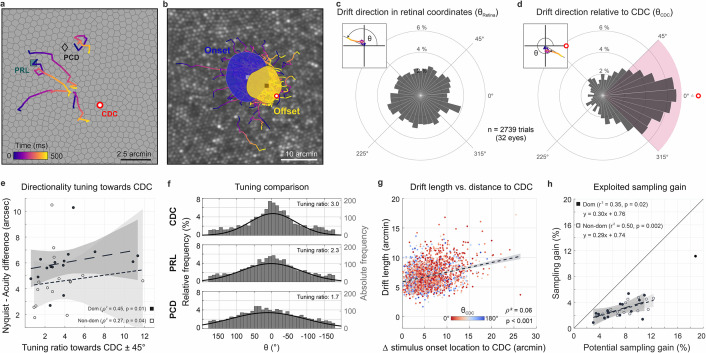
Figure 4.

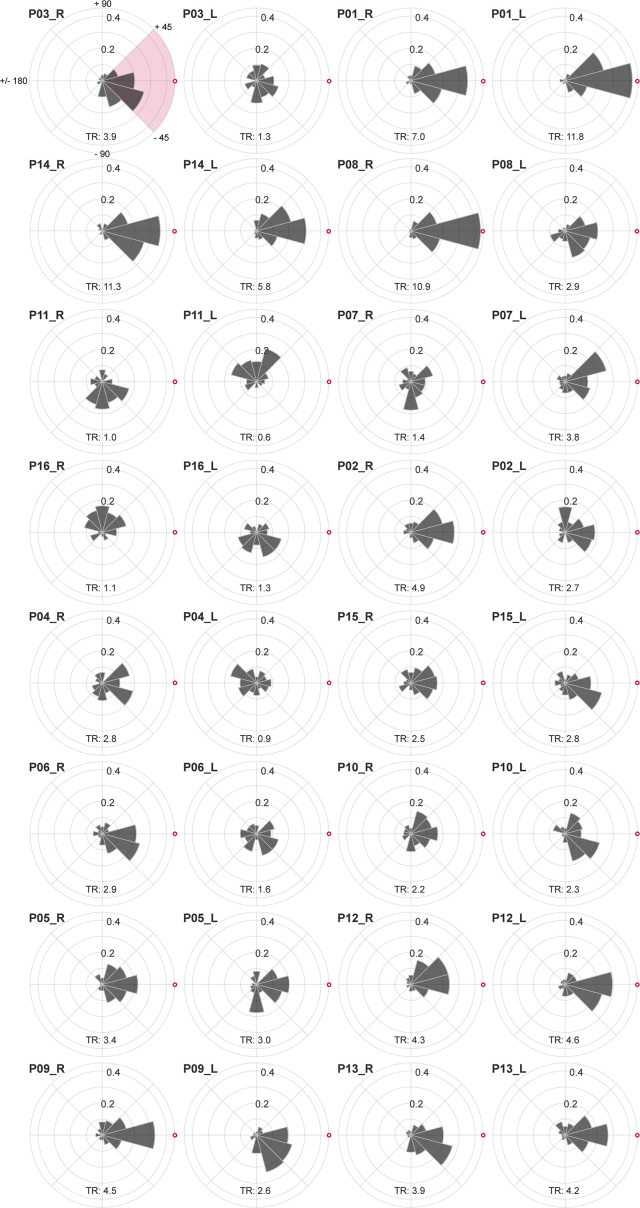
Figure 4—figure supplement 1. Individual drift directionality.

Figure 4—figure supplement 1.

Sorted according to their dominant eyes cone density centroid (CDC) to preferred retinal locus (PRL) distance (largest to smallest) eyes drift directionality is shown relative to the CDC. The CDC is indicated by a red circle with white fill. Participant numbers (P01 to P16) are assigned based on the dominant eye’s visual acuity threshold (best to worst). The upper left plot shows the angular labels exemplarily for all eyes. The tuning ratio was computed as the ratio between the relative frequency of intra-participant drift motion towards the CDC (±45 deg), indicated by the pink quarter, and the average of drift motion towards the remaining three quadrants.
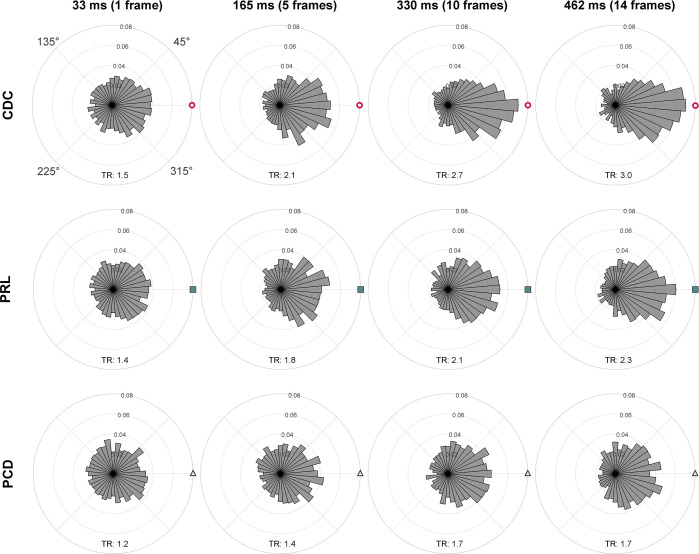
Figure 4—figure supplement 2. Time course of drift directionality.

Figure 4—figure supplement 2.

The angles θ cone density centroid (CDC), θ preferred retinal locus (PRL), and θ peak cone density (PCD) for all eyes were computed over time, relative to the stimulus onset, and are shown after 33 ms (one frame), 165 ms (five frames), 330 ms (10 frames), and 462 ms (14 frames). The respective tuning ratio (TR) is shown in the bottom part of each subplot. The tuning ratio was computed as the ratio between the relative frequency of inter-participant drift motion towards the CDC (±45 deg) and the average of drift motion towards the remaining three quadrants. For all cases, the circular data are not distributed uniformly around the circle (Rayleigh test, p<0.001, with increasing significance for longer durations). The distributions were compared against each other by the Kolmogorov-Smirnov test. Only CDC vs. PRL (33 ms) and PRL vs. PCD (33 ms) show no statistically significant difference. The distribution towards CDC compared to PCD is significantly different for 33 ms (p=0.002). For all other time points, all distributions are significantly different from each other, with increasing significance for longer durations (for 462 ms, all p<0.001).
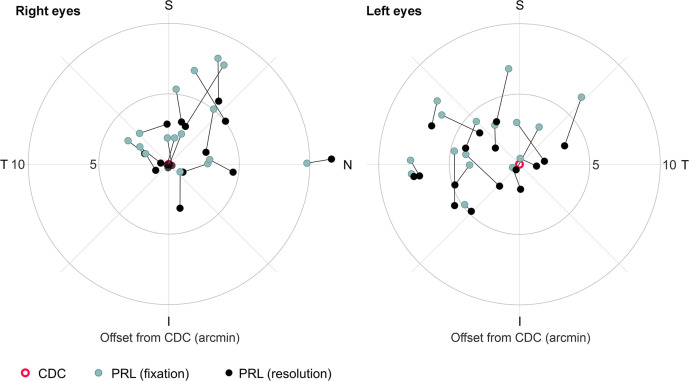
Figure 4—figure supplement 3. Different retinal locations used in a fixation or resolution task.

Figure 4—figure supplement 3.

Median preferred retinal locus (PRL) locations of all participants’ right and left eyes plotted in retinal coordinates relative to the cone density centroid (CDC). Retinal locations are plotted in teal for the fixation task and in black for the resolution task. A black line connects the retinal locations of the same participant.