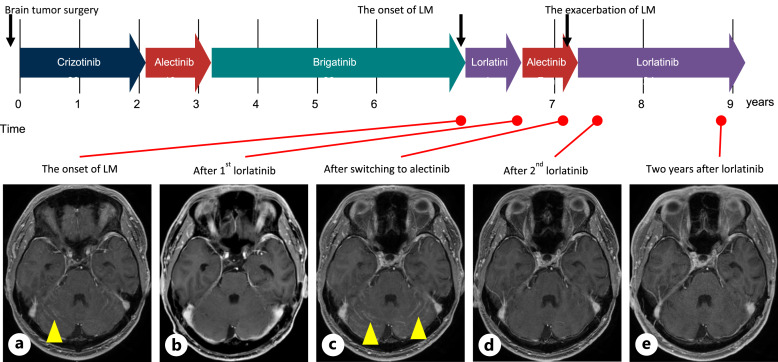
Fig. 3.
Timeline of the patient’s treatment history and representative brain MRI. Brain MRI at the onset of LM (a), after 1st lorlatinib (b), after switching to alectinib (c), after 2nd lorlatinib (d), and at present (e). Yellow arrow: leptomeningeal metastases. LM, leptomeningeal metastases; MRI, magnetic resonance imaging.

