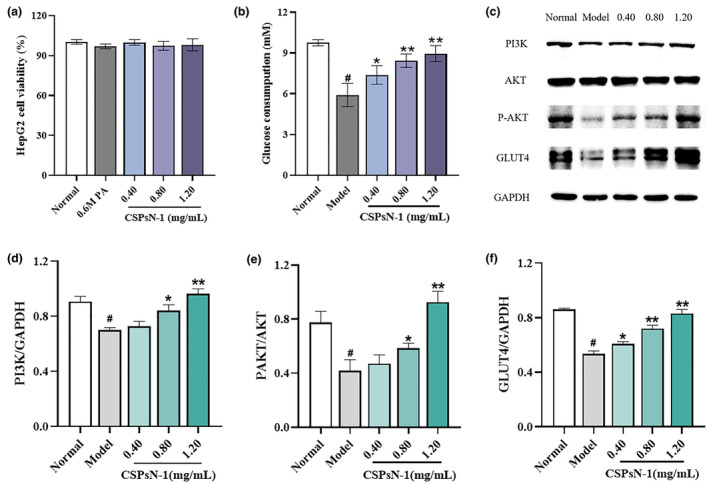
FIGURE 4.

(a) Cell viability of HepG2 cells determined by MTT method. (b) Effect of CSPsN‐1 on the levels of glucose consumption. (c–f) The protein expression levels of PI3K, P‐AKT, and GLUT4. # p < .01 versus the normal control group, *p < .05 versus the PA model group, and **p < 0.01 versus the PA model group.
