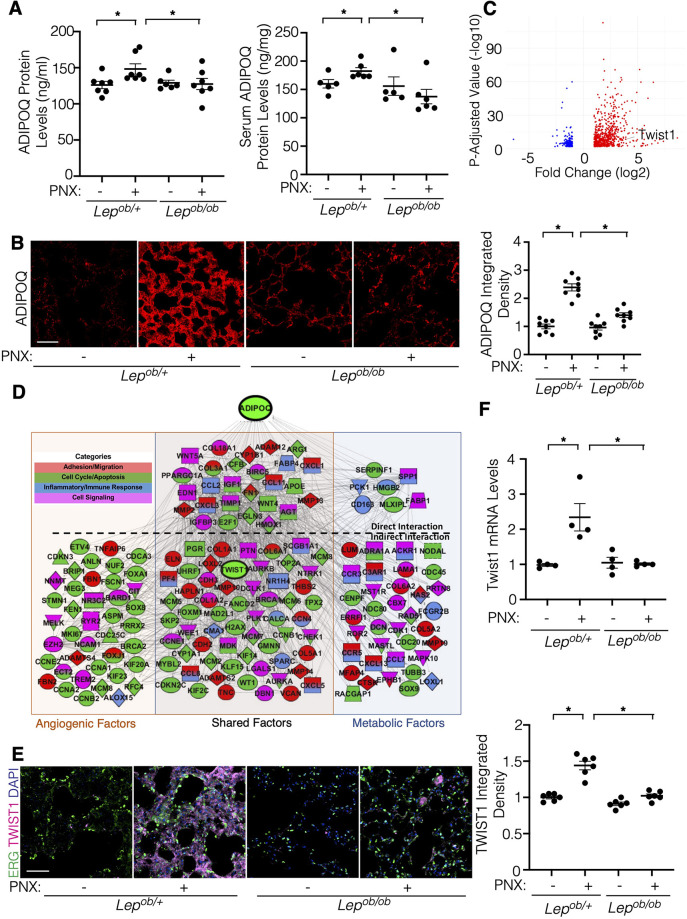
Figure 2.
Post-PNX increases in the adiponectin (ADIPOQ) expression are suppressed in Lepob/ob mice. (A) Graphs showing the quantification of ADIPOQ protein expression in the Lepob/+ or Lepob/ob mouse lungs (left) and serum (right) 7 days after PNX (n = 5–7, mean ± s.e.m., *p < 0.05). (B) IF micrographs showing ADIPOQ expression in the Lepob/+or Lepob/ob mouse lungs 7 days after PNX. Scale bar, 50 μm. Graph showing the ADIPOQ expression (n = 8, mean ± s.e.m., *p < 0.05). (C) Volcano plots of 903 significantly differentially expressed genes in ECs isolated from C57BL6 mouse lungs 7 days after PNX compared to those in sham-operated mouse lungs (GSE179227). Twist1 is a significantly differentially expressed gene. (D) Gene expression profiles and networks in ECs isolated from post-PNX (day 7) vs. sham-operated mouse lungs. (E) IF micrographs showing ERG-positive ECs, TWIST1 expression and DAPI in the Lepob/+ or Lepob/ob mouse lungs 7 days after PNX. Scale bar, 50 μm. Graph showing the TWIST1 expression in the Lepob/+ or Lepob/ob mouse lungs 7 days after PNX (n = 6, mean ± s.e.m., *p < 0.05). (F) Graph showing the Twist1 mRNA levels in the Lepob/+ or Lepob/ob mouse lung ECs 7 days after PNX (n = 4, mean ± s.e.m., *p < 0.05).

