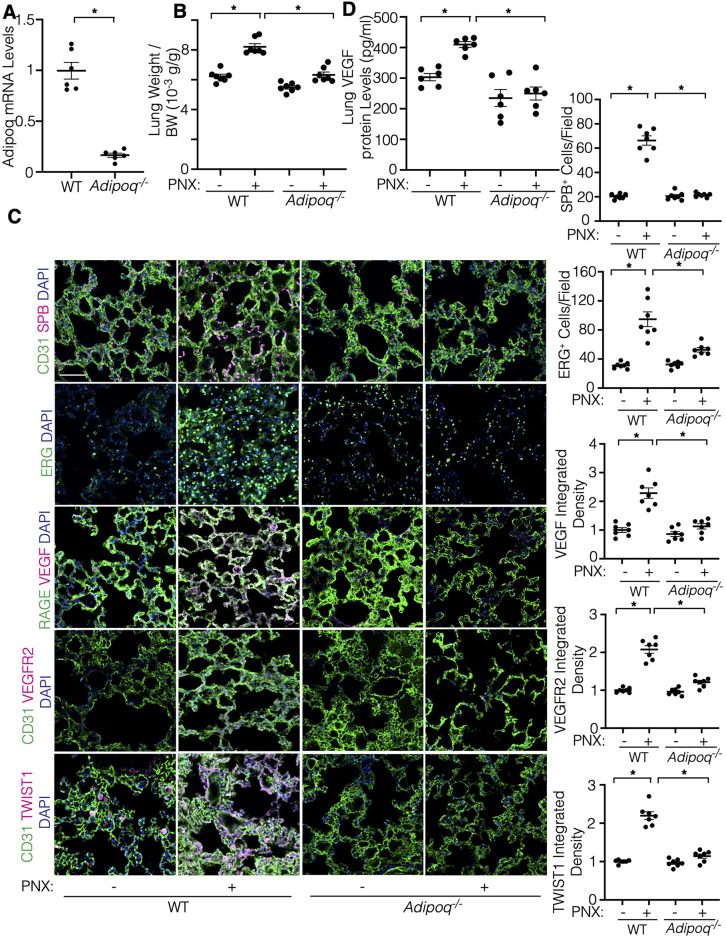
Figure 3.
Post-PNX regenerative lung growth is inhibited in the Adipoq−/− mouse lungs. (A) Graph showing the adiponectin mRNA levels in the Adipoq−/− or control WT mouse lungs (n = 6, mean ± s.e.m., *p < 0.05). (B) Graph showing the ratio of the weight of right lung lobe to body weight (BW) in Adipoq−/− or control WT mice 7 days after PNX (n = 7, mean ± s.e.m., *p < 0.05). (C) IF micrographs showing CD31-positive blood vessels, SPB-positive AT2 cells and DAPI (top), ERG-positive ECs and DAPI (2nd), RAGE-positive alveolar epithelial cells, VEGF expression and DAPI (3rd), CD31-positive blood vessels, VEGFR2 expression and DAPI (4th), and CD31-positive blood vessels, TWIST1 expression and DAPI (bottom) in the Adipoq−/− or control WT mouse lungs 7 days after PNX. Scale bar, 50 μm. Graphs showing the quantification of SPB-positive AT2 cells (top), ERG-positive ECs (2nd), VEGF expression (3rd), VEGFR2 expression (4th), and TWIST1 expression (bottom) in the Adipoq−/− or WT mouse lungs 7 days after PNX (n = 7, mean ± s.e.m., *p < 0.05). (D) Graph showing the VEGF protein levels in the Adipoq−/− or control WT mouse lungs 7 days after PNX (n = 6, mean ± s.e.m., *p < 0.05).

