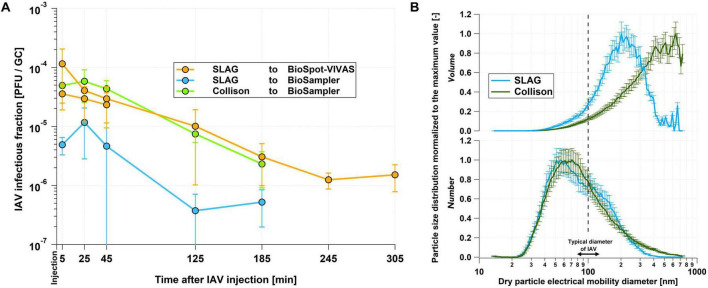
FIGURE 2.
Comparison of infectivity and size distribution results from nebulizers and samplers. (A) IAV infectious fraction measured at 25% RH after 5, 25, 45, 125 and 185 min for different combinations of nebulizers and samplers. In order to make the data comparable, they were normalized so that the infectious fraction in the inoculated medium was identical for the three combinations. The “SLAG to BioSpot-VIVAS” experiment was duplicated as part of the experiments discussed in Section “Medium preparation and sample handling”. The error bars indicate the 95% confidence interval on the technical triplicates. (B) Normalized size distributions of dry particle volume density (top panel) and number density (bottom panel) averaged over the first 5 min after virus nebulization in the chamber of the LAPI BREATH as measured by the SMPS. The normalization was performed with respect to the highest value of each size distribution. The dash line indicates the typical size of an IAV. The medium used for these experiments was PBS. Based on the results of the infectious fraction and the size distributions as well as the large amount of virus stock required to operate the Collison nebulizer, we decided to perform the experiments with the SLAG/BioSpot-VIVAS combination. The error bars indicate the counting uncertainty from the SMPS.

