
Figure 3.
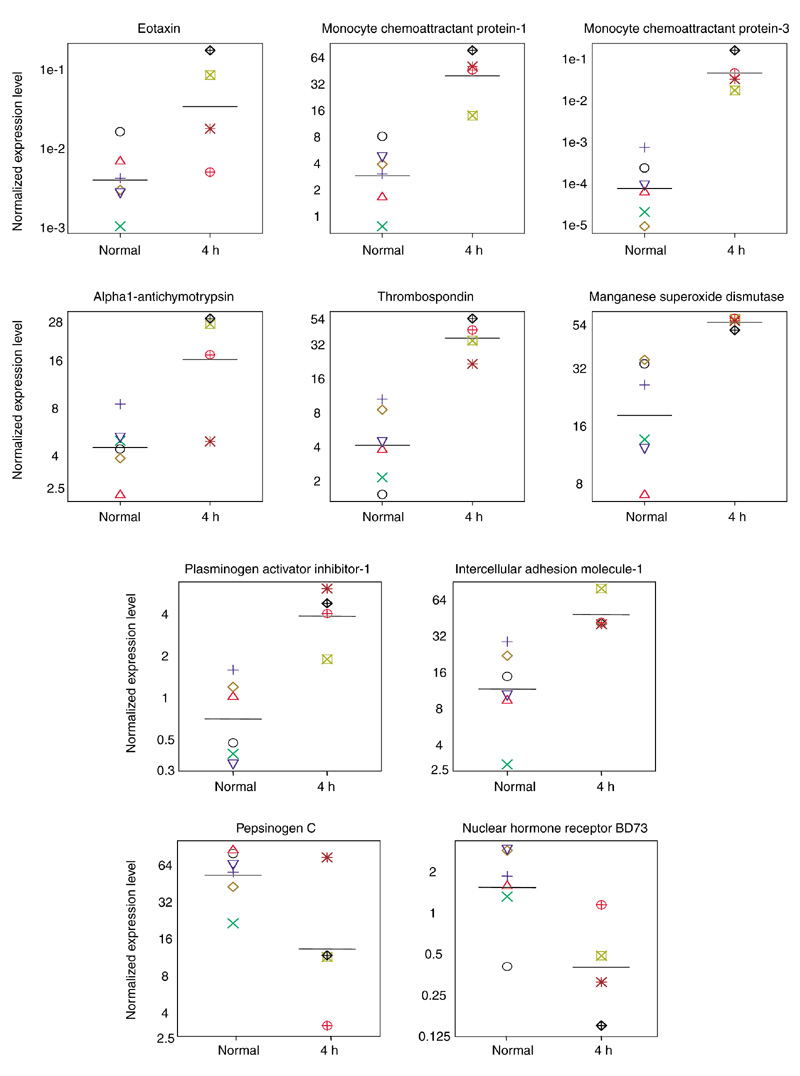
Gene-expression levels in multiple individual monkey lungs determined by RT-PCR. Expression levels in control unchallenged monkeys (normal, n = 6) and 4-h post-challenge monkey lungs (4 h, n = 4) are shown. Genes shown are those that are significantly different between these two groups (p < 0.1, unpaired t-test, Table 2). Expression levels in each animal were calculated as described in Materials and methods and normalized to HPRT, and are on a log scale. The 4-h challenged monkey used in the microarray analysis is designated by the green boxed cross ( ).
).