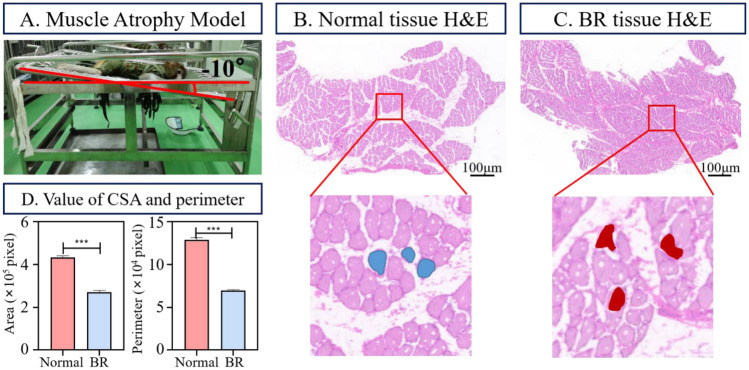
Fig. 2.
Example of H&E muscle fiber images. A The process of establishing a weightlessness model for macaques. B The H&E image of normal shank muscle tissue, with the blue area indicating normal muscle fibers. C H&E image of the atrophic shank muscle tissue, with the red area indicating the atrophic muscle fibers. D On the 42nd day, changes in CSA and perimeter of normal and BR macaque muscle fibers

