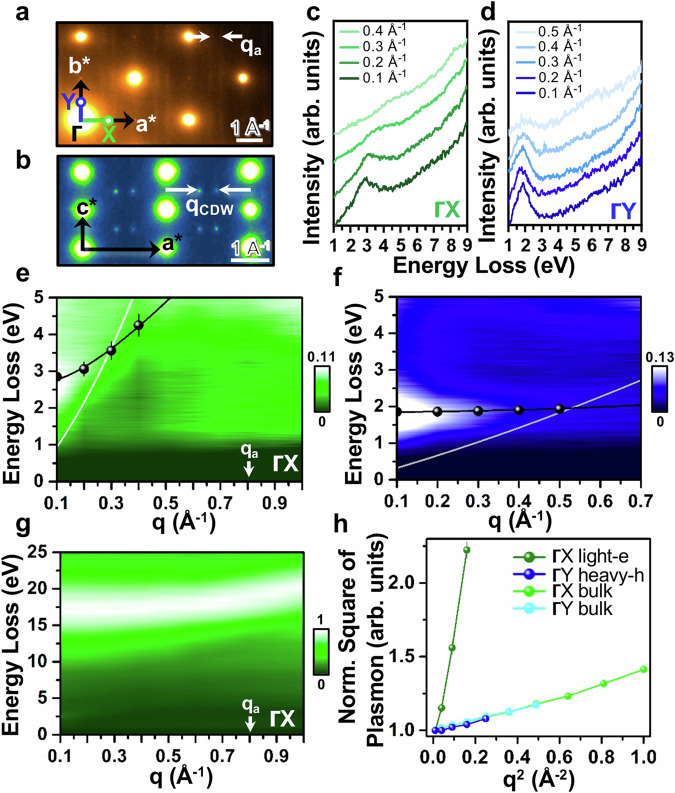
Fig. 2. q-EELS investigations of plasmon dispersions in the CDW state at 300 K.
a The first ΓX and ΓY Brillouin zones by SAED. qa, the projected a*-component of qCDW onto this basal plane. b SAED pattern of the a*c* plane with the direct observation of qCDW. c and d q-EELS measurements of the dispersions of respective Te-px light-electron and Te-py heavy-hole plasmons along ΓX and ΓY. e and f The respective plasmon-dispersion maps corresponding to c and d and further incorporating spectra up to the zone boundaries. g The bulk-plasmon dispersion map along ΓX. All spectra in c–g, ZLP removed. Black dots in e–f, pseudo-Voigt-fitted plasmon peak positions (error bars and also those in (h), standard errors in the fitting). Black curves in e–f calculated dispersions using Eq. (1). White curves in e–f the respective single-particle continua. h The scaling of the dispersions of ΓX light-electron, ΓY heavy-hole, ΓX bulk, and ΓY bulk plasmons in respective e–g and Supplementary Fig. 6a. Normalizations to the respective excitations at q2 = 0.01 Å−2 facilitate a direct comparison across different plasmons.

