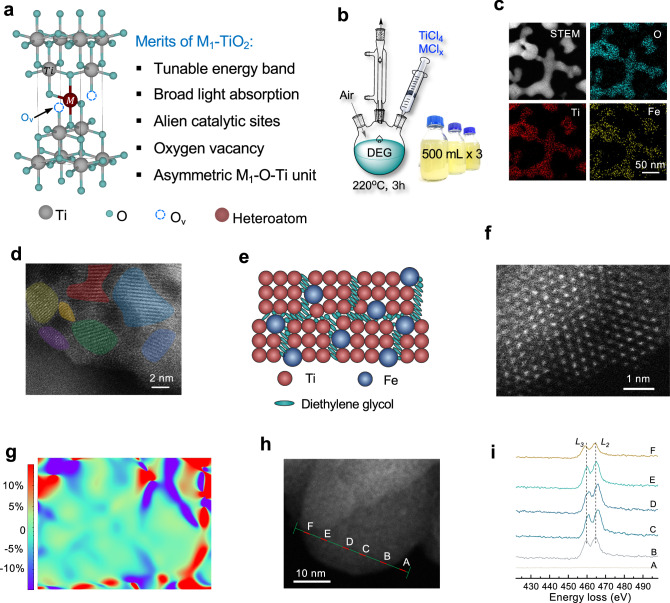
Fig. 1. Diethylene glycol (DEG)-assisted synthesis of Fe1-TiO2 nanostructures.
a Merits of Fe1-TiO2 nanostructures. b Schematic of the setup and reaction and digital image of the mass production of Fe1-TiO2/H2O dispersion with a mass concentration of 5 mg·mL‒1. c Scanning transmission electron microscopy and elemental maps of Fe1-TiO2 nanostructures. d High-resolution transmission electron microscope image of Fe1-TiO2 nanostructures. The colored regions represent crystal domains. e Schematic of Fe1-TiO2 nanostructures. f, g Aberration-corrected scanning transmission electron microscopy (AC-STEM) image and corresponding geometric phase analysis (GPA) image of crystal domain in Fe1-TiO2. h, i Electron energy loss spectroscopy (EELS) of Fe1-TiO2 nanostructures performed on AC-STEM. The red dots correspond to the positions of the EELS line scan. The EELS spectra of Ti-L2,3 edge exhibits two groups of peaks, L3 and L2, associated with electronic transitions from initial 2p3/2 and 2p1/2 core states to final 3d states in the conduction band. Source data are provided as a Source Data file.

