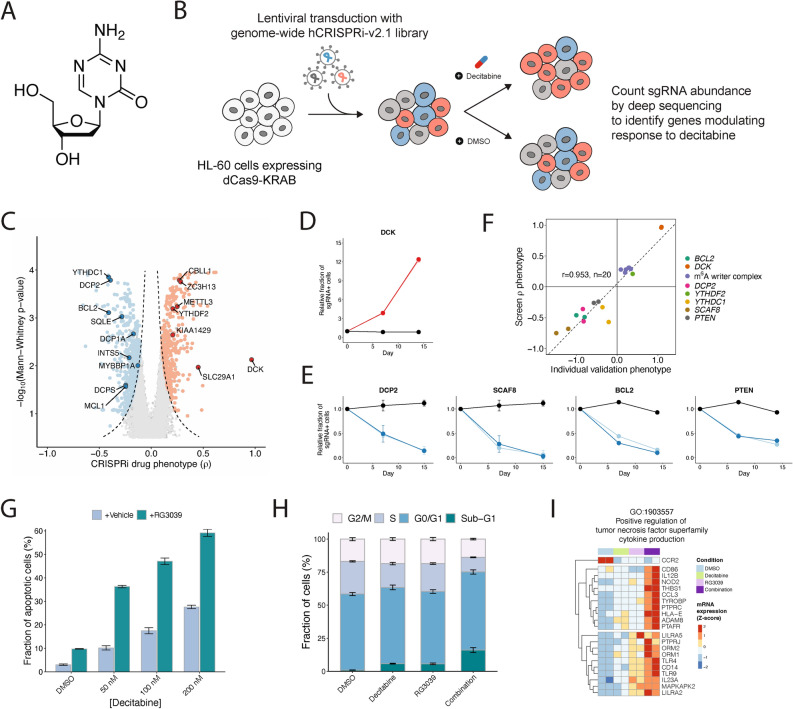
Fig. 1.
A genome-scale CRISPRi screen reveals gene knockdowns that confer sensitivity or resistance to 5-aza-2’-deoxycytidine (decitabine). (a) The chemical structure of decitabine. (b) Schematic of a genome-scale CRISPRi screen performed in HL-60 cells. (c) Volcano plot of gene-level rho (ρ) phenotypes and Mann–Whitney p-values. Negative rho values represent increased sensitivity to decitabine after knockdown, and positive rho values represent increased resistance. (d–e) Validation of top screen hits. HL-60i cells were transduced with a control sgRNA (black) or an active sgRNA (red or blue) and treated with DMSO or decitabine, and the proportion of sgRNA + cells in the decitabine condition relative to DMSO was observed over time. Data are shown as means ± SD, two sgRNAs per gene and two replicates per sgRNA. (f) Scatter plot showing the correlation between screen rho phenotype and validation phenotype (day 14–15 post-infection) for each validated sgRNA. (g) A cleaved caspase 3/7 assay shows the fraction of apoptotic HL-60 cells at day 5 following treatment with DMSO or decitabine ± RG3039. Data are shown as means ± SD for three replicates. (h) A cell cycle assay shows the fraction of HL-60 cells at different phases of the cell cycle at day 5 following treatment with DMSO or decitabine ± RG3039. Data are shown as means ± SD for three replicates. (i) Normalized counts for genes in GO:1,903,557 (positive regulation of tumor necrosis factor superfamily cytokine production) upregulated upon decitabine and RG3039 treatment.

