Fig. 2.
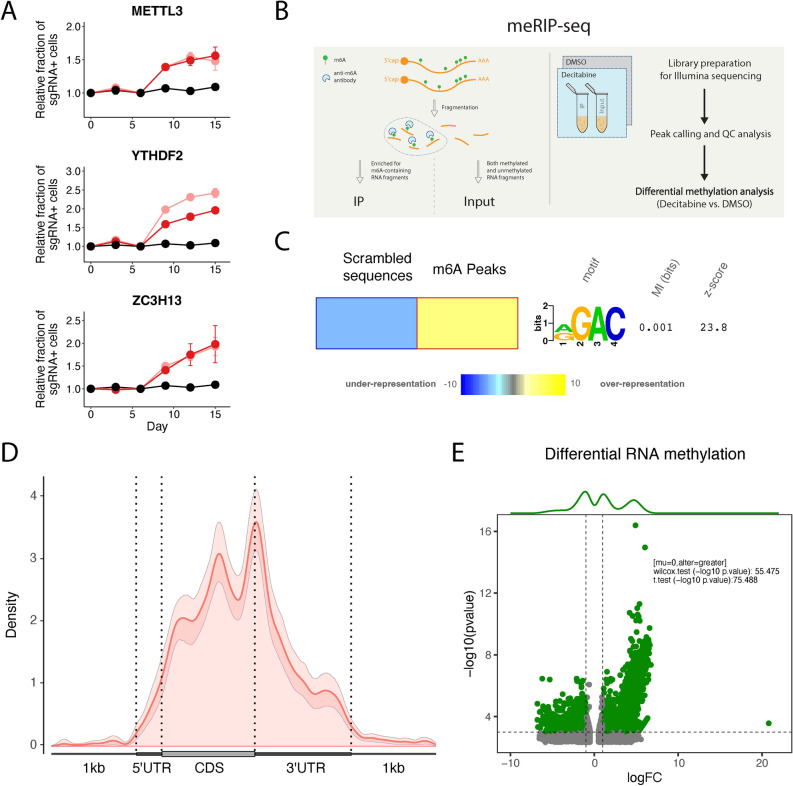
Decitabine treatment of HL-60 cells results in global m6A hypermethylation. (a) Validation of CRISPRi decitabine screen hits shows that knockdown of m6A-reader/writer complex genes promotes resistance to decitabine treatment in HL-60i cells. HL-60i cells were transduced with a control sgRNA (black) or an active sgRNA (red or pink) and treated with DMSO or decitabine, and the proportion of sgRNA + cells in the decitabine condition relative to DMSO was observed over time. Data are shown as means ± SD, two sgRNAs per gene and two replicates per sgRNA. (b) Schematic of MeRIP-seq experimental design and computational workflow. (c) The FIRE algorithm (in non-discovery mode) shows the known m6A motif RGAC ([AG]GAC) is enriched among predicted MeRIP-seq peaks relative to randomly generated sequences with similar dinucleotide frequencies. Data are shown as a heatmap, where yellow indicates over-representation and blue represents under-representation. Color intensity indicates the magnitude of enrichment. (d) Metagene plot shows distribution of m6A sites along transcripts with differential regional methylation and enrichment of m6A sites near the end codon. Transcripts are grouped into CDS (protein coding region), 5’ UTR (untranslated region) and 3’ UTR methylation based on the identified m6A sites. (e) Differential methylation analysis shows significant changes in RNA methylation peaks in HL-60 cells treated with decitabine (relative to DMSO). Peaks are called using the RADAR algorithm and visualized as annotated volcano plots. Wilcoxon and t-tests are used to assess statistical significance of global hypermethylation.

