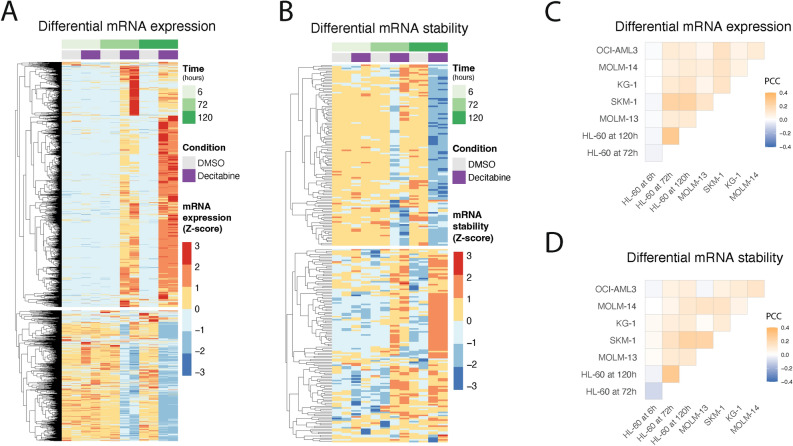
Fig. 3.
An analysis of differential gene expression and RNA stability across multiple AML cell lines and time points following decitabine treatment. (a,b) RNA-seq reveals genes with significant changes in (a) gene expression and (b) RNA stability in HL-60 cells following treatment with decitabine vs. DMSO. Data are shown as heatmaps displaying counts (of two replicates) row-normalized into Z-scores, grouped by treatment condition and time. Differential RNA expression was calculated using our Salmon-tximport-DESeq2 pipeline. RNA stability was predicted using the REMBRANDTS algorithm and differential RNA stability was calculated using limma. (c,d) RNA-seq shows varying degrees of concordance of differential (c) gene expression and (d) RNA stability across a panel of six AML cell lines. The correlation analysis was performed on the logFC values from (c) DESeq2 and (d) limma results for cells treated with decitabine vs. DMSO. Data are shown as correlation matrices with Pearson’s correlation coefficients (PCC).

