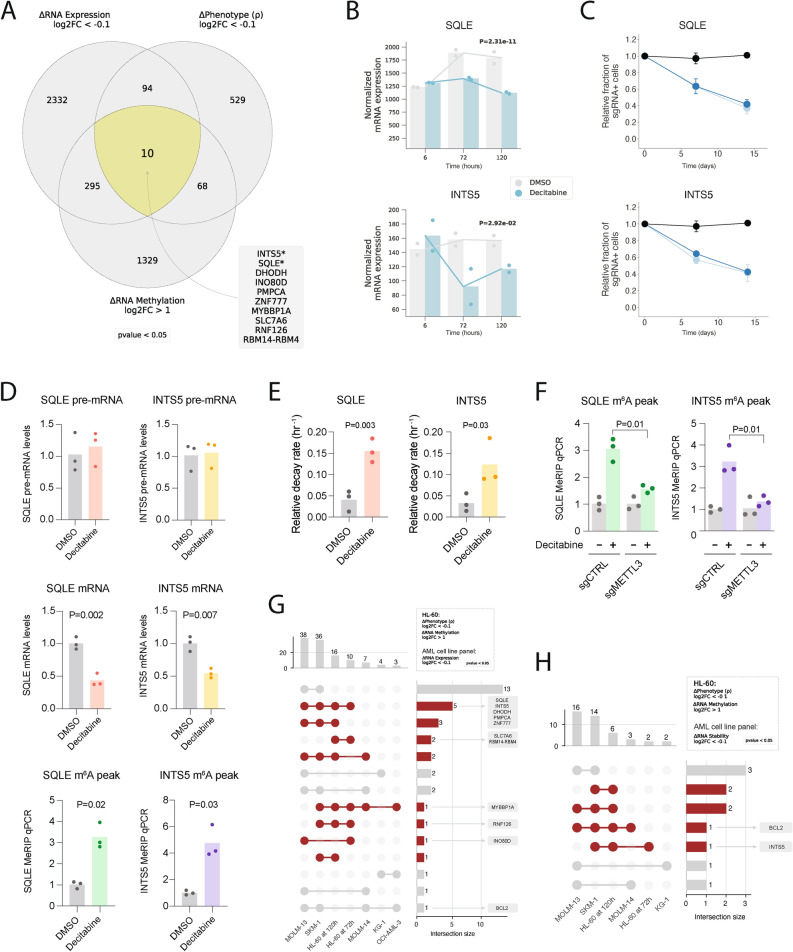
Fig. 4.
Charting genes likely downregulated due to m6A hypermethylation in HL-60 cells treated with decitabine and validating SQLE and INTS5. (a) Venn diagram visualization of three sets of genes across multiomics datasets (i.e., CRISPRi screen, RNA-seq and MeRIP-seq) for HL-60 cells treated with decitabine vs. DMSO. 10 overlapping genes were shown to have (1) a sensitizing phenotype in our CRISPRi screen, (2) RNA hypermethylation upon decitabine treatment and (3) downregulation of mRNA upon decitabine treatment. (b) Normalized RNA-seq counts for SQLE and INTS5 in HL-60 cells treated with decitabine vs. DMSO at 6 h, 72 h and 120 h. Data are shown as two replicates and p-values were generated using a likelihood ratio test in DESeq2 comparing the decitabine and DMSO conditions at 72 h. (c) Validation of CRISPRi decitabine screen hits show that SQLE and INTS5 knockdown promotes sensitivity to decitabine treatment in HL-60i cells. HL-60i cells were transduced with a control sgRNA (black) or an active sgRNA (blue) and treated with DMSO or decitabine, and the proportion of sgRNA + cells in the decitabine condition relative to DMSO was observed over time. Data are shown as means ± SD, two sgRNAs per gene and two replicates per sgRNA. (d) MeRIP-RT-qPCR in HL-60 cells treated with DMSO (gray) or decitabine (colored) validates decitabine-induced mRNA decay and RNA hypermethylation of SQLE and INTS5 transcripts. Three sets of primers were designed to capture abundances of pre-mRNA (top), mature mRNA (middle) and predicted m6A hypermethylated loci for each gene (bottom). Data are shown as three replicates and one-tailed Mann–Whitney U-tests were used to assess statistical significance. (e) RT-qPCR validation of decitabine-induced mRNA decay of SQLE and INTS5 using α-amanitin. HL-60 cells were treated with DMSO (gray) or decitabine (colored) ± α-amanitin and RT-qPCR captured mRNA abundance. Relative decay was defined as the ratio between samples with and without α-amanitin for each respective condition. Data are shown as three replicates, and one-tailed Mann–Whitney U-tests were used to assess statistical significance. (f) MeRIP-RT-qPCR in HL-60 cells reveals METTL3 as a regulator of decitabine-induced m6A hypermethylation of SQLE and INTS5. Cells were transduced with a control sgRNA or METTL3-targeting sgRNA, treated with DMSO (gray) or decitabine (colored), and MeRIP-RT-qPCR captured abundance of predicted m6A hypermethylated loci. Data are shown as three replicates and one-tailed Mann–Whitney U-tests were used to assess statistical significance. (g,h) UpSet plots visualizing the intersection between genes which were (1) RNA hypermethylated upon decitabine treatment in HL-60 and (2) sensitizing hits in the HL-60 CRISPRi screen with (g) genes downregulated and (h) RNA destabilized across six AML cell lines.

