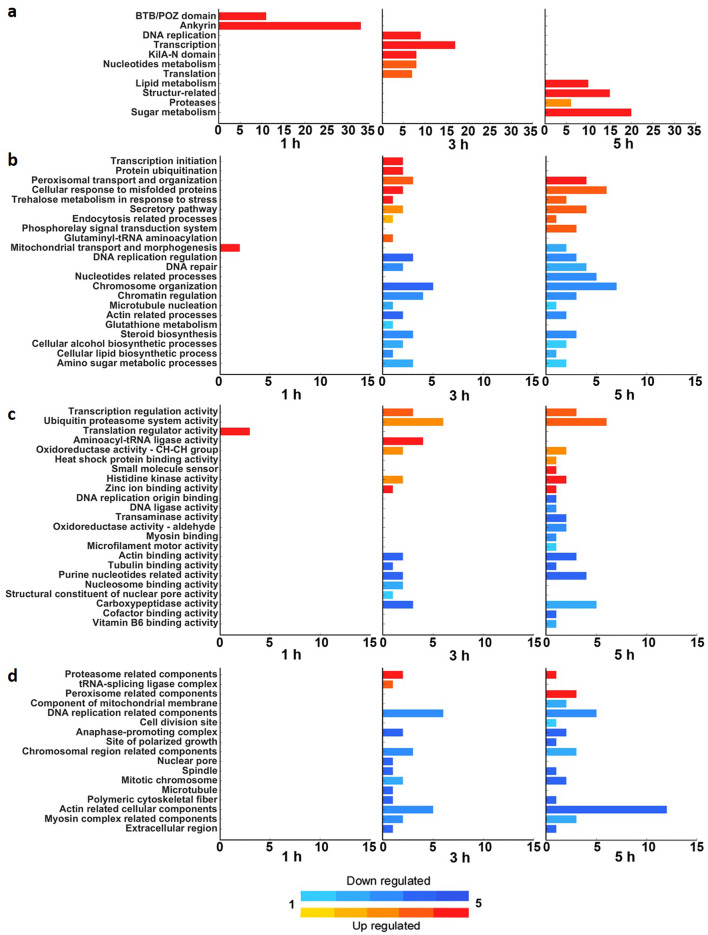
Fig. 3.
Functional enrichment analysis. Functional enrichment analysis of Mimivirus bradfordmassiliense (Mimivirus) (a) and Acanthamoeba polyphaga (AP) (b–d). For Mimivirus, each category comprises a group of genes, with the bar size proportional to the number of genes in the category (a). For AP (b–d), the genes are annotated to each GO term, with groups of GO terms subsequently semi-automatically grouped into categories. Each category is represented by a bar whose size is proportional to the number of GO terms it includes. The functional enrichment analysis is presented with respect to the three principal GO domains: (b) biological processes; (c) molecular function; and (d) cellular components. The coloring of the bars indicates whether the category became enriched in up-regulated (red) or down-regulated (blue) genes over the course of infection. The hue represents the significance of the enrichment; in a, it is the p-value of the enriched category, and in b-d, it is based on the average p-value of the GO terms in the category.

