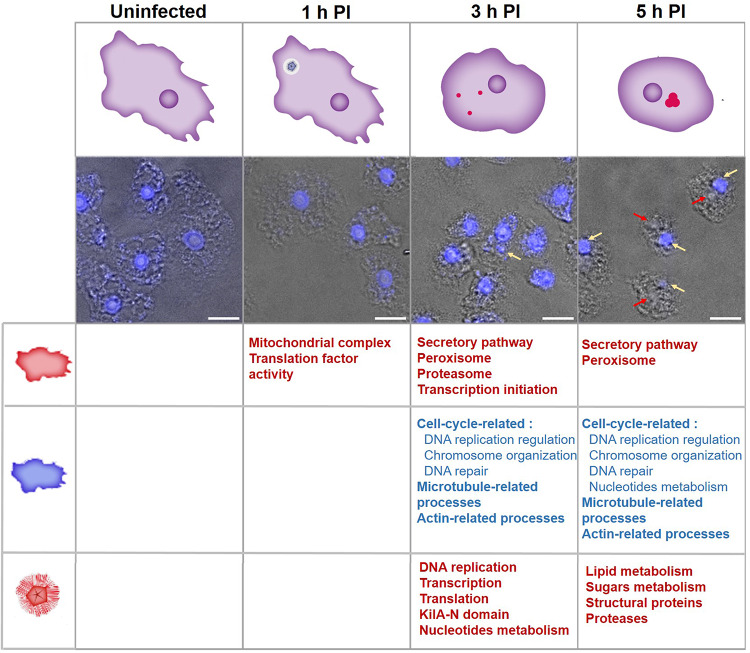
Fig. 5.
Summary of the Acanthamoeba polyphaga (AP) and Mimivirus bradfordmassiliense (Mimivirus) transcriptome enrichment analysis. Columns represent time points post-infection. Upper panel: cell state illustration showing the nucleus (dark purple), viral factory (red), and Mimivirus (blue pentagon in a white circle).  —Nucleus,
  —Viral factory. Lower panel: transmission light microscopy with DAPI labeling. Scale bar: 10 µm. Table at bottom: Summary of the processes that were upregulated in AP
  , downregulated in AP
  , and upregulated in Mimivirus
  .
.

