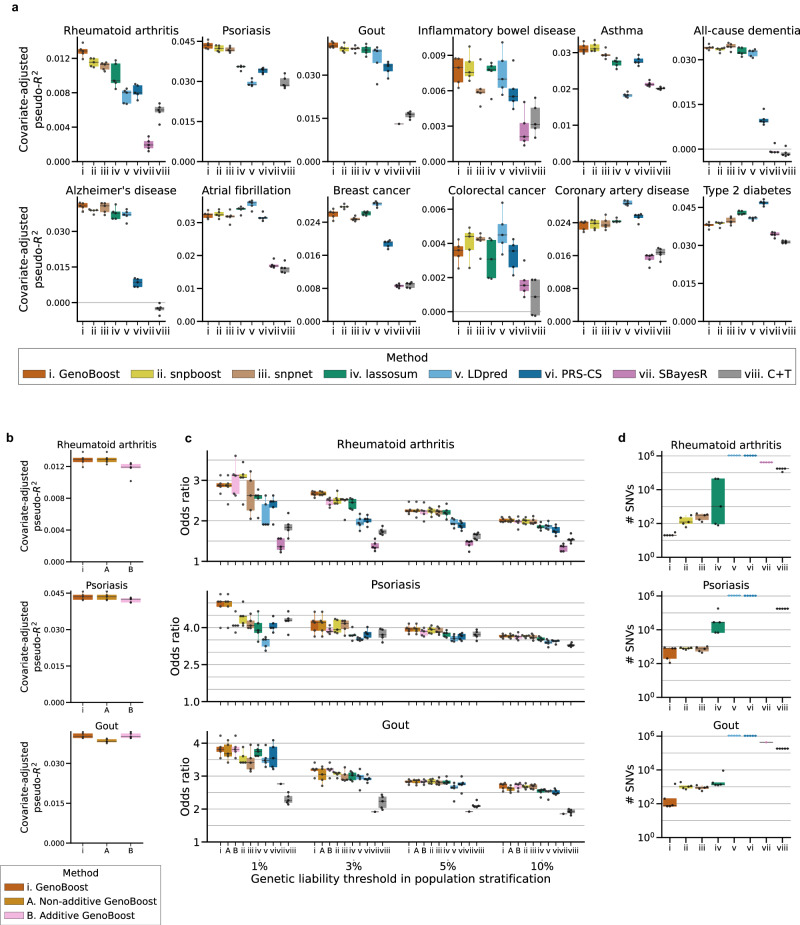
Fig. 2. Benchmarking GenoBoost across twelve disease outcomes in UK Biobank.
a Predictive performance in covariate-adjusted pseudo-R2 across eight PGS methods (i-viii, including GenoBoost) and twelve disease outcomes in UK Biobank. C + T: clumping and thresholding. b Comparison of Additive (method A) and Non-additive (method B) GenoBoost in their predictive performance across three immune-related disorders: rheumatoid arthritis, psoriasis, and gout. The GenoBoost PGS (method i) was selected between the two based on the predictive performance in the validation set. c Comparison of the eight genotype-only PGS models in their ability to stratify case individuals in the top 1, 3, 5, or 10 percentile (x-axis) of the predicted PGS scores in the held-out test set. We show the odds ratio comparing the stratified individuals and the remainder of the population. d Number of selected genetic variants (y-axis) in eight PGS models. The y-axis is shown in a log scale. The results from five-fold cross-validation (n = 5 folds) are shown in the plots. The box plots show the median and interquartile range (IQR, defined as the difference between the third and the first quartile points, i.e., Q3 and Q1) with whiskers (Q1-1.5 * IQR and Q3 + 1.5 * IQR). SBayesR raised convergence error for psoriasis and Alzheimer’s disease and for four out of five cross-validations of gout. Source data are provided as a Source Data file.

