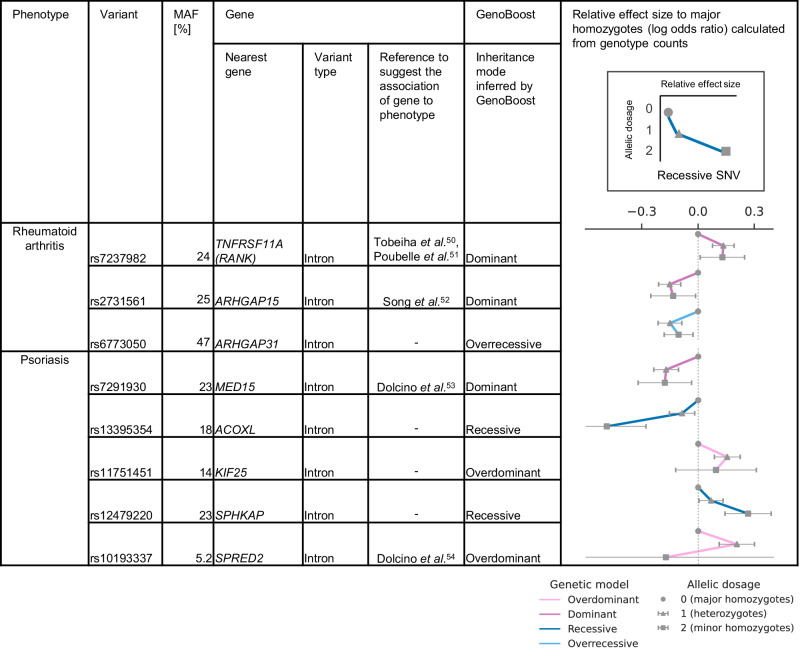
Fig. 4. Prioritizing genetic loci previously not reported in the literature with GenoBoost.
Three and five genetic variants selected for rheumatoid arthritis and psoriasis in GenoBoost are shown as illustrative examples, where GenoBoost selected the genetic variants with inferred non-additive genetic dominance effects, and their closest genes (within the 1Mbp window) were not reported in the GWAS catalog. We show the following in the table: phenotype, variant, minor allele frequency (MAF), annotated gene symbol, and predicted consequence of genetic variant, references for the literature reporting the relevance of the closest gene in the phenotype, inferred mode of inheritance. The line plots in the rightmost column represent the log odds ratio (x-axis) of the sample counts of heterozygous and homozygous minor alleles relative to homozygous major alleles. The error bars represent the 95% confidence intervals for Wald’s statistics with n = 215,768 samples. The three dots connected by a line (y-axis) represent the allelic dosage of 0, 1, and 2 from the top to bottom. The color represents the inferred mode of genetic inheritance by GenoBoost. Source data are provided as a Source Data file.

