
Fig. 6. Evaluating the spatial distribution of re-emergent H5 HPAI outbreaks in Yunlin county (YL).
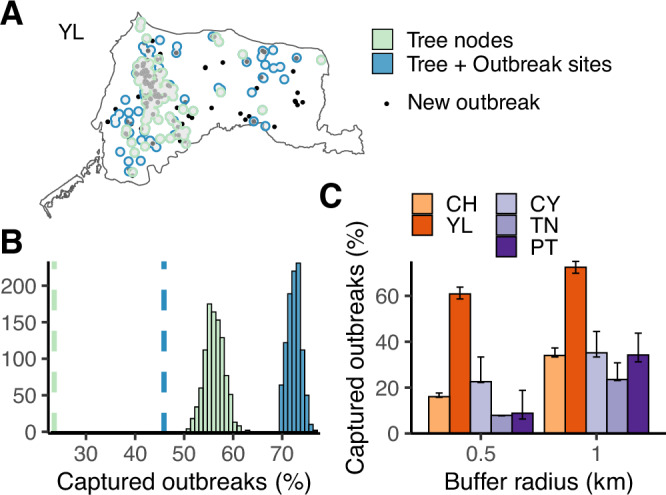
A An example from a randomly selected posterior tree. The black points indicate reported outbreak sites that occurred between 2019 and 2022, after the latest available genetic data. The green/blue areas created by merged buffers indicate the inferred hotspots. B Distributions of captured new outbreaks by inferred epidemic hotspots based on 1 km-buffers with centres of nodes only (green) or nodes plus outbreak sites (blue). The vertical dashed lines indicate the mean of randomly generated circulating areas with identical buffer numbers as tree nodes (green) or tree nodes plus outbreak sites (blue). C Comparing the re-emergence of outbreaks within inferred hotspots in different locations. Proportions of captured outbreaks were calculated with buffers of two radius distances. The bars show the mean values based on 1000 posterior trees. Error bars indicate 95% credible intervals.