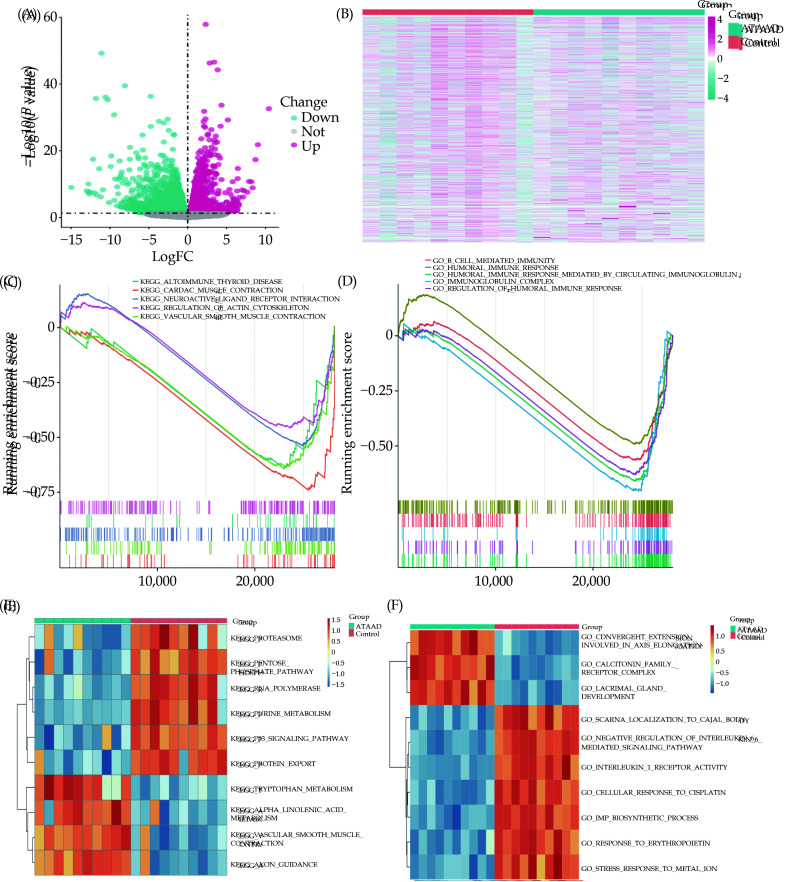
Figure 2.
Differential expression of DEGs and enrichment analysis in GSE153434 dataset.
(A-B): Volcano plot (A) and heatmap (B) of 45 DEGs between the ATAAD and control groups. For volcano plot, pink point represents the up-regulated DEGs, blue represents the down-regulated DEGs, and gray represents the non-differential genes. (C-D): KEGG pathways (C) and GO functional sets (D) significantly enriched associated with ATAAD were searched using GSEA analysis. (E-F): The top 10 pathways (E) and the top 10 GO functional sets (F) with the most significant differences between the ATAAD and control group, were obtained using the GSVA algorithm. ATAAD: acute Stanford type A aortic dissection; DEGs: differentially expressed genes; GO: Gene Ontology; GSEA: Gene Set Enrichment Analysis; GSVA: Gene Set Variation Analysis; KEGG: Kyoto Encyclopedia of Genes and Genomes.

