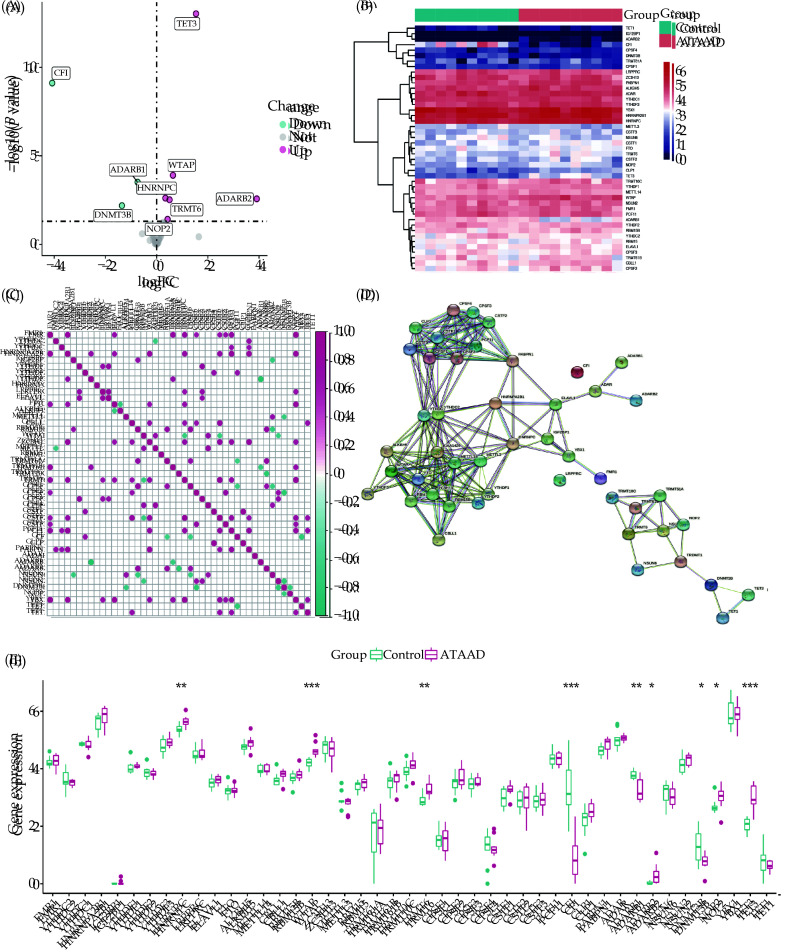
Figure 3.
Differential expression of RNA modification genes.
(A): The volcano plot illustrates the differences in RNA modification genes between the ATAAD and control groups. Pink representing upregulated genes, blue representing downregulated genes, and gray representing genes with no significant difference. (B, C): Heatmaps and boxplots depict the transcriptomic expression profiles of the 45 DEGs. (D): Protein-protein interaction network diagram of RNA modification genes. (E): Boxplot displays the differential expression of 45 DEGs between the ATAAD and control groups.

