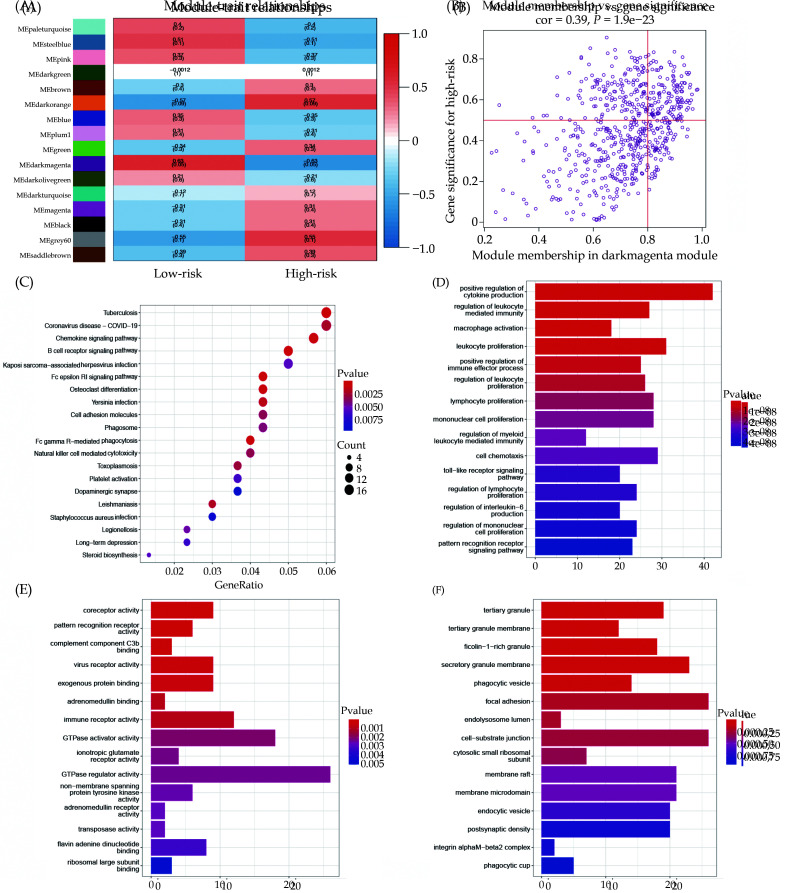
Figure 8.
WGCNA analysis of RNA modification high-risk and low-risk groups.
(A): The WGCNA heatmap displays the correlation between different modules and high-low risk groups; (B): correlation between darkmagenta module genes and RNA modification high-risk group; (C): KEGG enrichment analysis of darkmagenta module genes; and (D-F): enrichment analysis of darkmagenta module genes of BP, MF, and CC were analyzed by GO analysis. BP: biological processes; MF: molecular functions; CC: cellular components.

