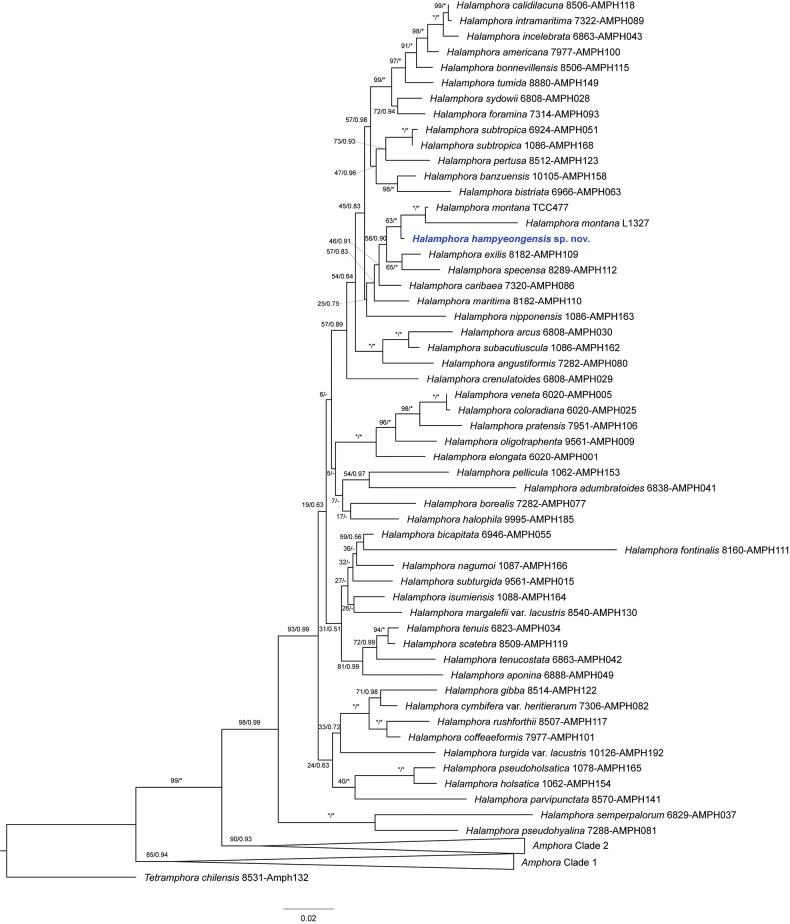
Figure 3.
A molecular phylogenetic tree obtained from ML and BI analysis based on the concatenated dataset (18S rDNA and rbcL gene) showing the phylogenetic positions of H.hampyeongensis. A phylogenetic tree was generated through a ML analysis. The values on each node indicate ML bootstrap and Bayesian posterior probabilities, respectively. The asterisk indicates 100 in ML and 1 in BI, and – indicates the topological incongruence between ML and BI trees. The H.hampyeongensis is highlighted in bold blue.

