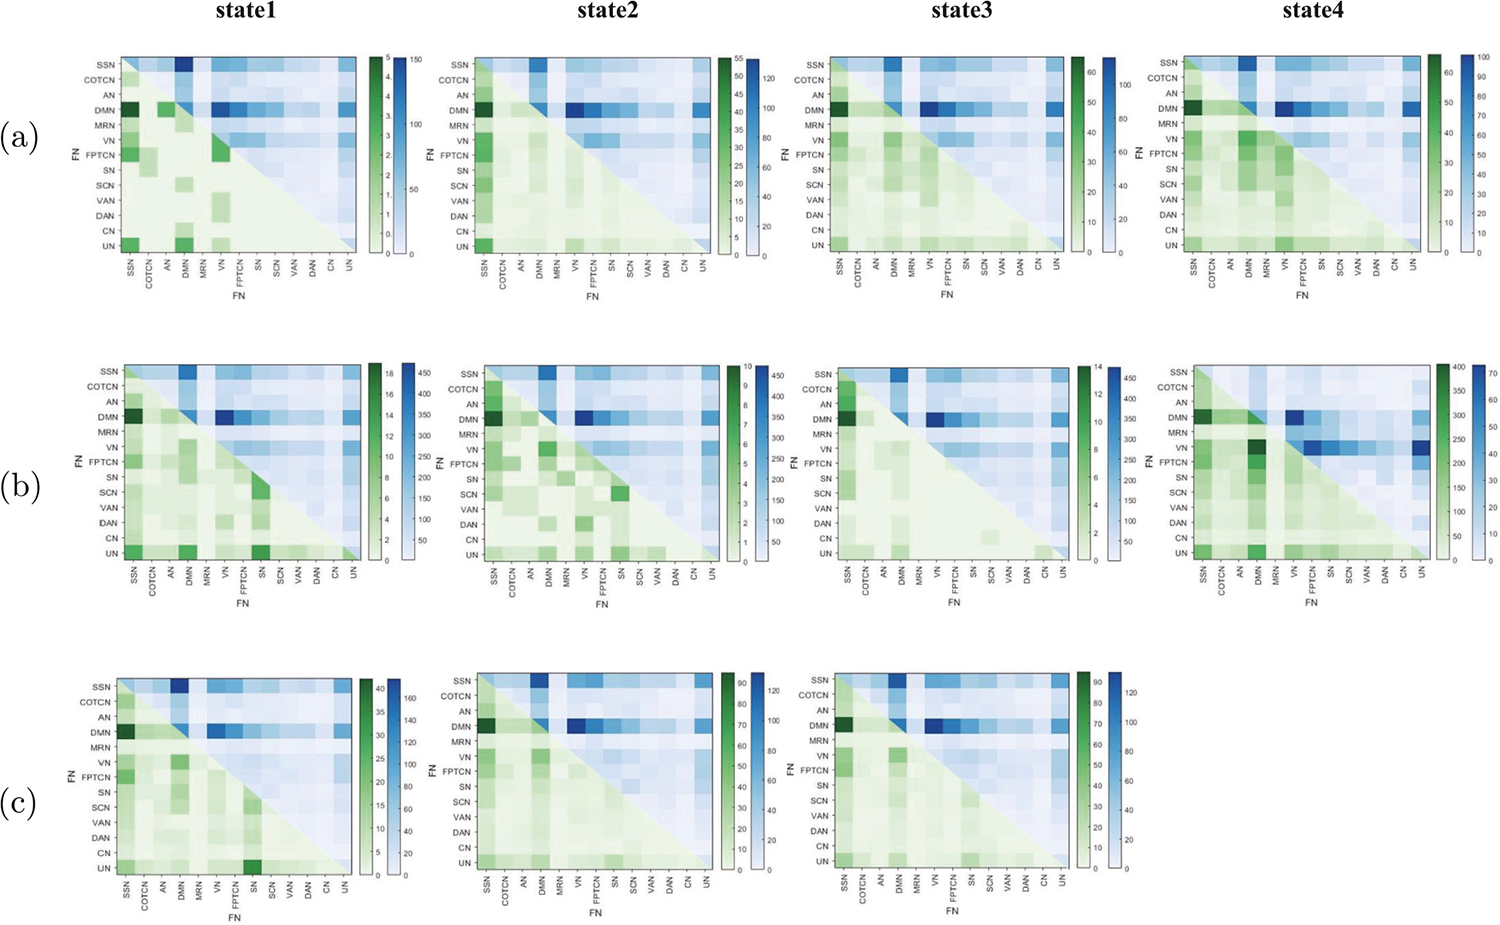
Fig. 3.

Extraction of dFC: (a), (b), (c) respectively, show the changes of dFC between and within FNs in different states of emoid fMRI, nback fMRI and rest fMRI during brain development. For each subfigure, the part of upper triangle represents the weakened dFC, the part of lower triangle represents the enhanced dFC.
