FIGURE 3.

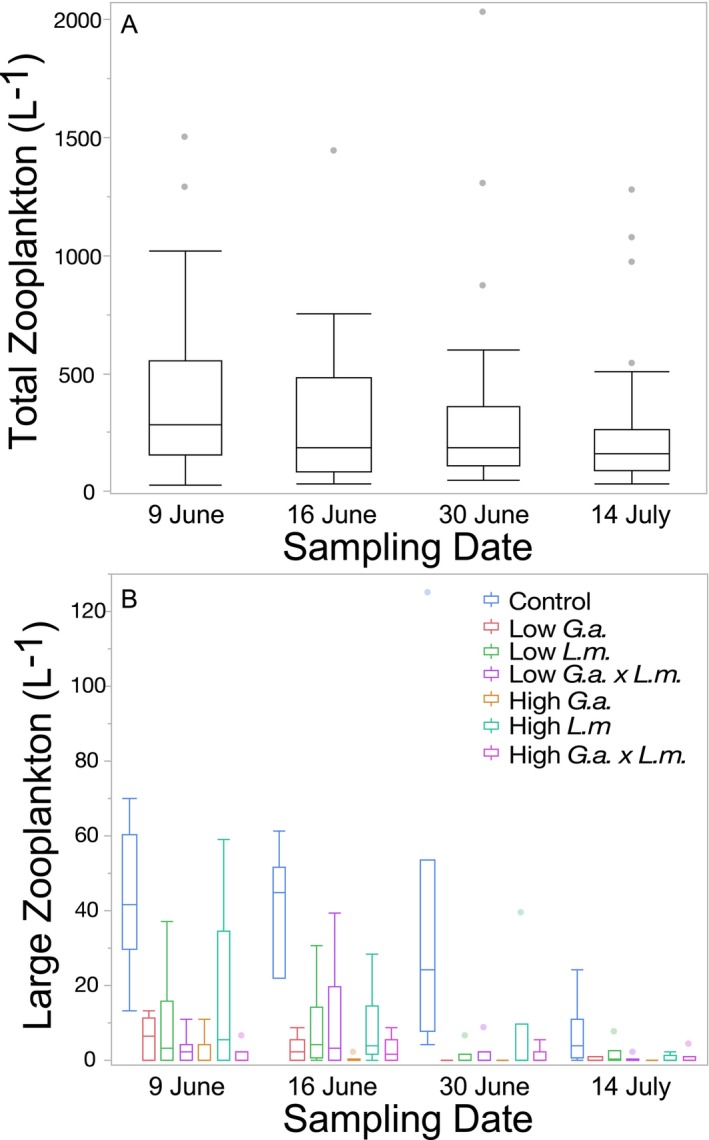
Boxplots with outliers of (A) total number of zooplankton per liter over the course of Experiment 1 and (B) the number of large zooplankton per liter in each treatment over the course of Experiment 1.

Boxplots with outliers of (A) total number of zooplankton per liter over the course of Experiment 1 and (B) the number of large zooplankton per liter in each treatment over the course of Experiment 1.