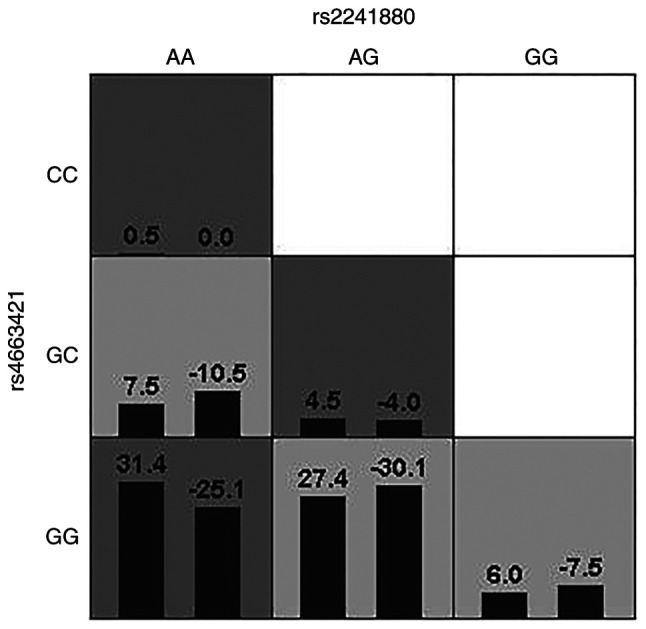
Figure 4.

Generalized multifactor dimensionality reduction analysis. A box represents an interaction combination; highrisk boxs are denoted by a dark color, lowrisk boxs are denoted by a light tint. In the same box, the left column is the positive score of the combination, and the right is the negative score; the higher the positive score, the higher the risk of antineutrophil cytoplasmic autoantibody-associated vasculitis (AAV) in the combo.
