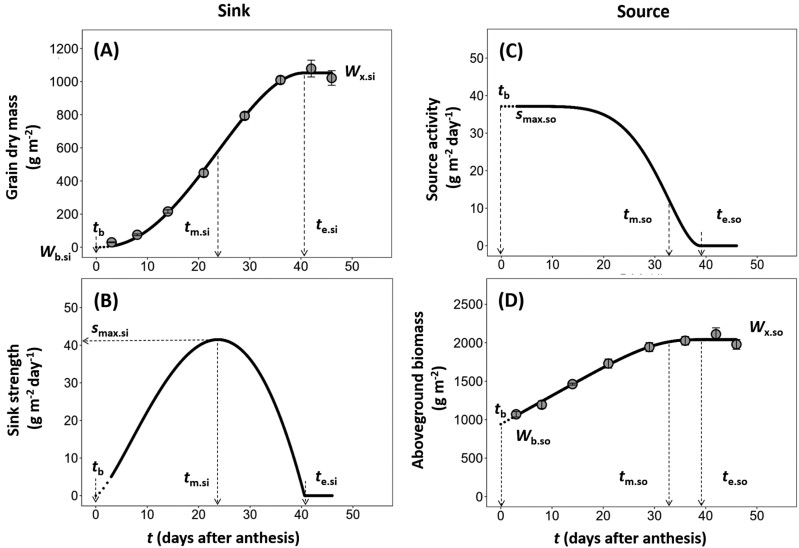
Fig. 2.
Example of the post-anthesis time course of the measured grain dry mass and total above-ground biomass per unit area and the resulting dynamics of daily sink strength and source activity during grain filling. (A) Time course of grain dry mass during the post-anthesis period as described by Equation (1). (B) Dynamics of resulting daily sink strength during the post-anthesis period as described by Equation (2). (C) Dynamics of daily source activity during the post-anthesis period as described by Equation (6). (D) Time course of above-ground biomass during the post-anthesis period as described by Equation (8). The symbols of the model parameters are defined in Table 1. All time parameters are expressed as days after anthesis. Data used for this example illustration are for the winter wheat genotype Thésée grown under outside ambient temperature conditions (Out°C) in EXP1994. In (A) and (D), circles and errors bars are means ±SE of three replicates.

