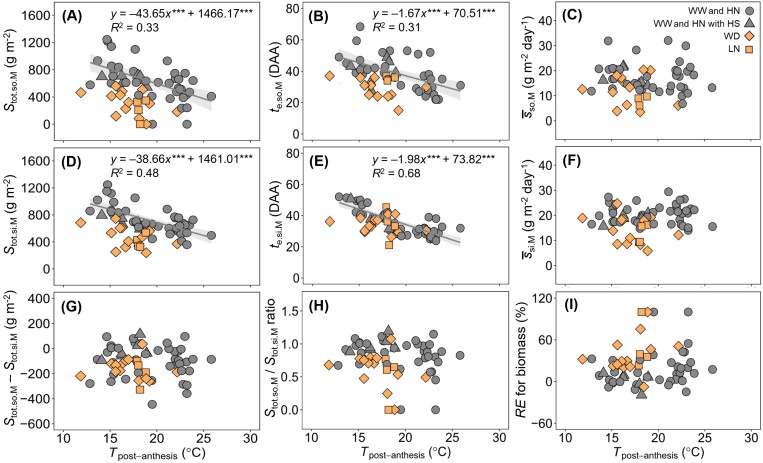
Fig. 5.
Post-anthesis source and sink parameters for biomass (M) versus average daily temperature of the period. (A–C) Temperature responses of total source supply (Stot.so.M), days after anthesis when the source activity has decreased to zero (te.so.M), and mean source activity (so.M) for biomass. (D–F) Temperature responses of total sink demand (Stot.si.M), days after anthesis when the daily sink strength has decreased to zero (te.si.M), and mean sink strength (si.M) for biomass. (G–I) Temperature responses of the difference between Stot.so.M and Stot.si.M, the ratio of Stot.so.M to Stot.si.M, and the contribution of remobilized pre-anthesis assimilates to final grain dry mass (RE for biomass). Lines are linear regression fitted to the data for the well-watered and high nitrogen supply regimes and are shown only when significant at P=0.05. *** indicates statistical significance at P<0.001. The shaded area depicts the 95% confidence interval of the predictions for the conditions well-watered and high nitrogen supply regimes. WW, well-watered; WD, water deficit; HN, non-limiting nitrogen; LN, low nitrogen supply; HS, heat shock.

