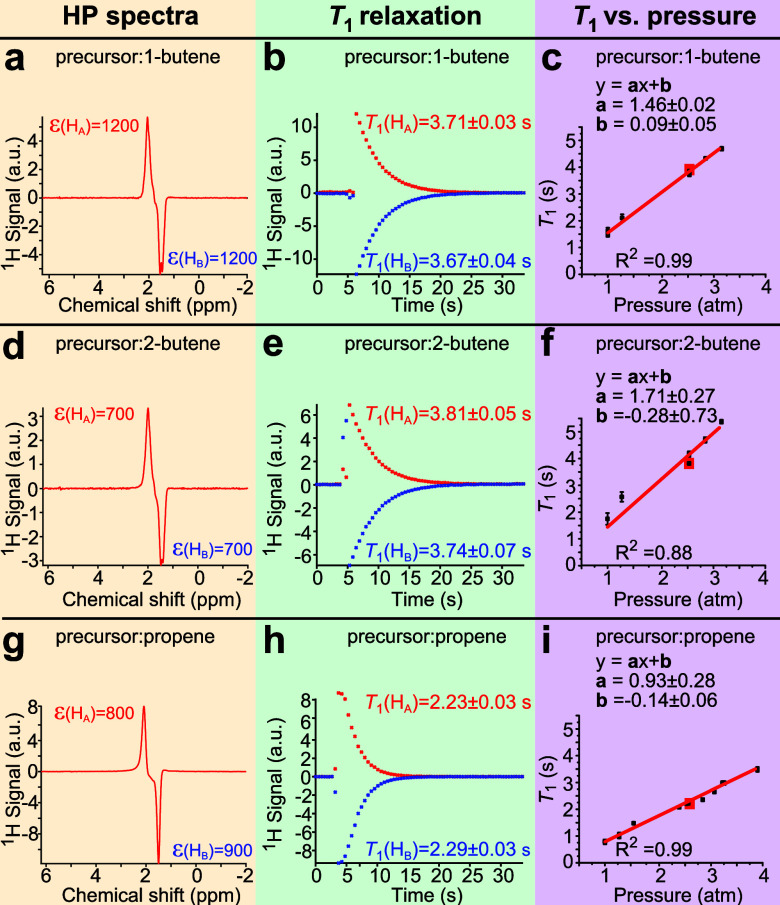
Figure 2.
NMR spectroscopy and relaxation dynamics of HP gas at 1.4 T and 2.5 bar pressure (except for panels c, f, and i, where variable pressure was employed). (a) 1H NMR spectrum of HP butane gas produced from 1-butene. (b) T1 relaxation decay of HA and HB protons of HP butane produced from 1-butene. (c) Pressure dependence of T1 (HA) of HP butane gas produced from 1-butene. (d) 1H NMR spectrum of HP butane gas produced from 2-butene. (e) T1 relaxation decay of HA and HB protons of HP butane produced from 2-butene. (f) Pressure dependence of T1 (HA) of HP butane gas produced from 2-butene. (g) 1H NMR spectrum of HP propane gas. (h) T1 relaxation decay of HA and HB protons in HP propane gas. (i) Pressure dependence of T1 (HA) in HP propane gas. Yellow, green, and purple color shading is used to guide the eye. Respective signal enhancements for HA and HB protons are given in red and blue for visual clarity. The NMR spectra and decay plots are shown for pressure values denoted by the corresponding red boxes in panels c, f, and i.

