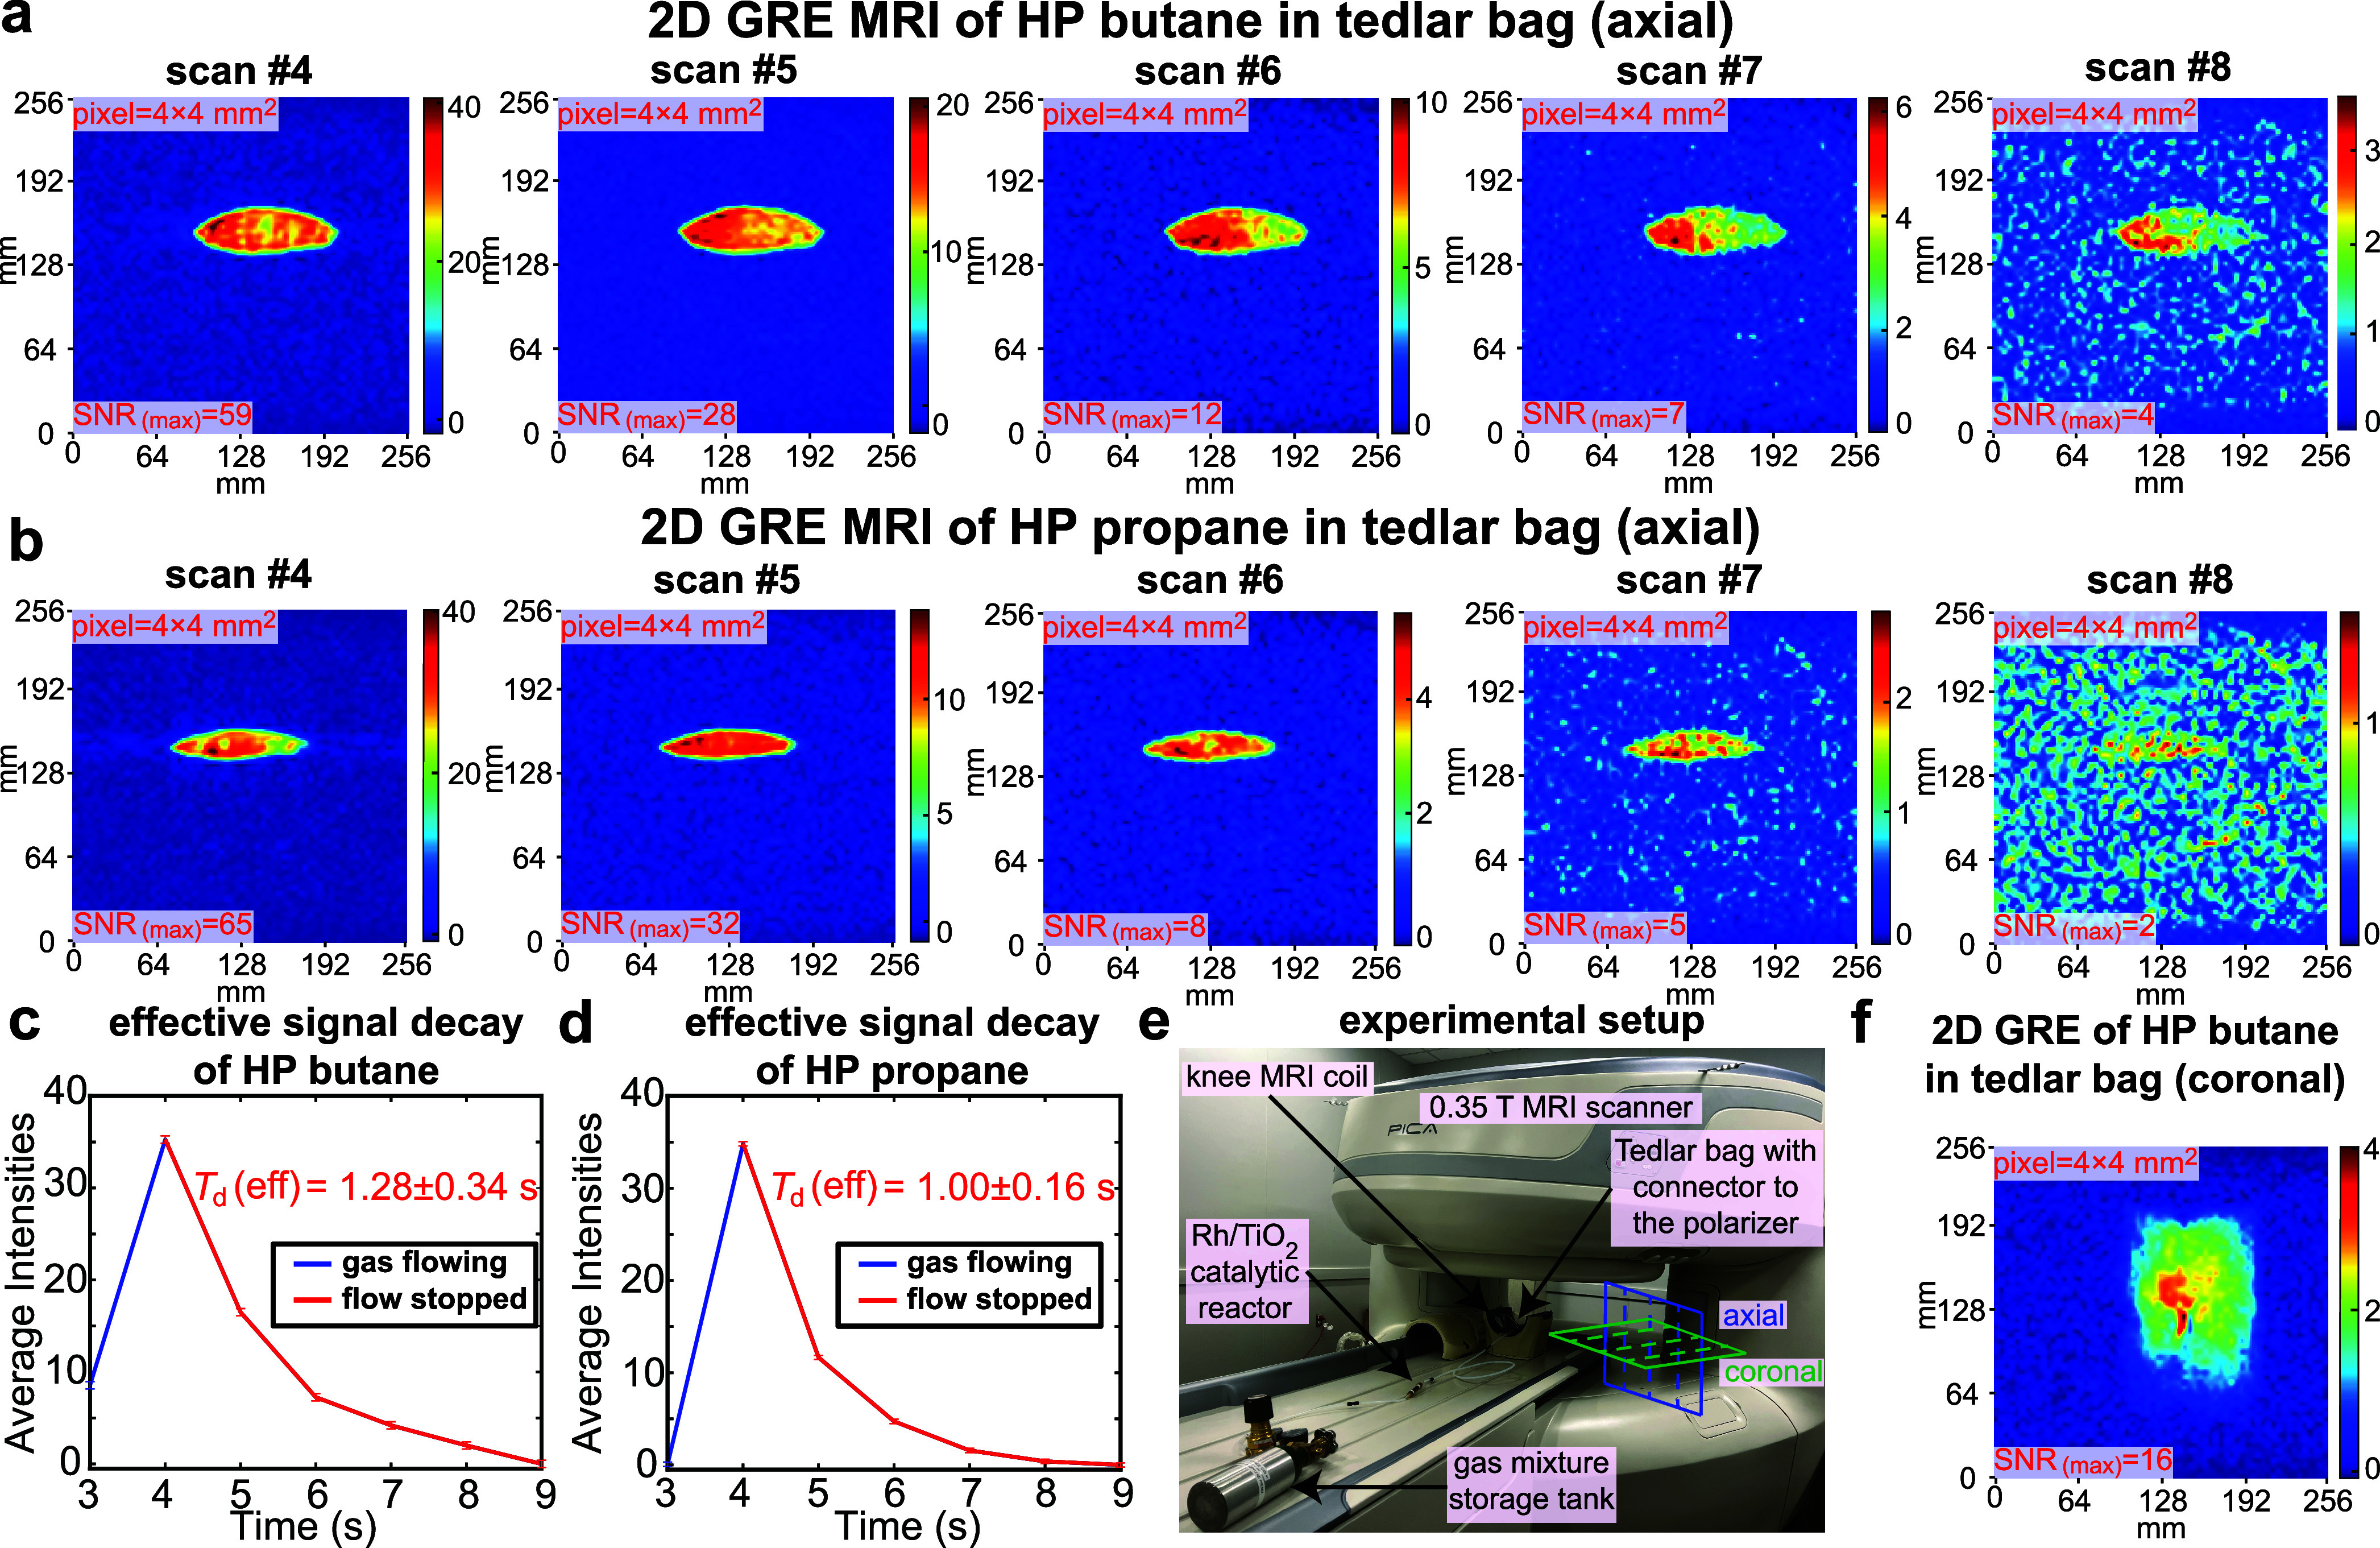
Figure 4.

Phantom imaging studies of high-capacity HP butane and propane production using a 0.35 T clinical MRI scanner. (a) Time series of 2D MRI scans recorded on HP butane gas immediately after gas injection inside the Tedlar bag. The duration or temporal resolution of each back-to-back scan is 0.97 s. The SNR(MAX) values were obtained by selecting the highest intensity pixel from a 3 × 3 matrix in the highest intensity region and dividing it by RMS noise (obtained as an RMS value of signal intensities from the pixels from 3 × 3 matrix elements in the noise region). (b) Corresponding imaging time series obtained using HP propane gas. (c) Signal decay of HP butane gas over time (1 s roughly corresponds to 1 scan). The last 5 data points during the HP gas signal decay (when gas was definitely stopped) were used to measure the effective monoexponential signal decay constant Td = 1.28 ± 0.34 s. (d) Corresponding effective signal decay of HP propane gas with effective Td value of 1.00 ± 0.16 s. (e) Annotated photo of experimental setup showing the gas mixture storage tank, Rh/TiO2 reactor, unmounted knee coil (axial and coronal planes indicated), and gas connection from the reactor outlet to the Tedlar bag (close-up photos are shown in Figures S6b and S10b). (f) Subsecond 2D GRE coronal image of HP butane injected in a Tedlar bag. All images were recorded with a 64 × 64 imaging matrix (converted to 256 × 256 in image post-processing) over 256 × 256 mm2 FOV, 50 mm slice thickness, and 30° slice-selective RF pulse.
