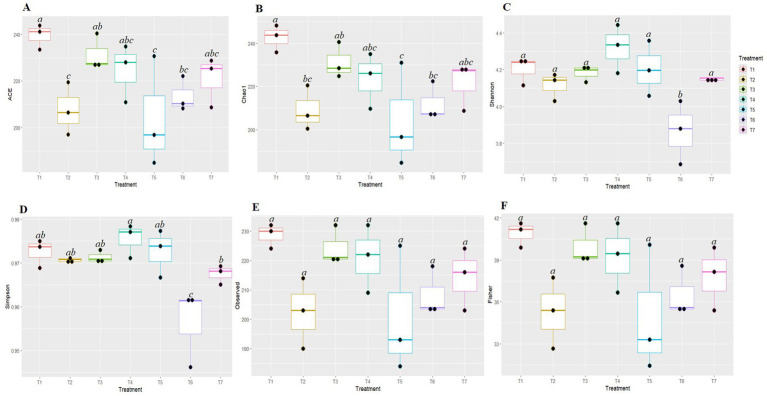
Figure 2.
Box plots represent different diversity indices (Ace (A), Chao1 (B), Shannon (C), Simpson (D), Observed (E) and Fisher (F)) among conservation agriculture-based production systems. Alphabets above box indicate significant differences among agricultural practices, (p < 0.05). Colors denote the different treatments on experiment.

