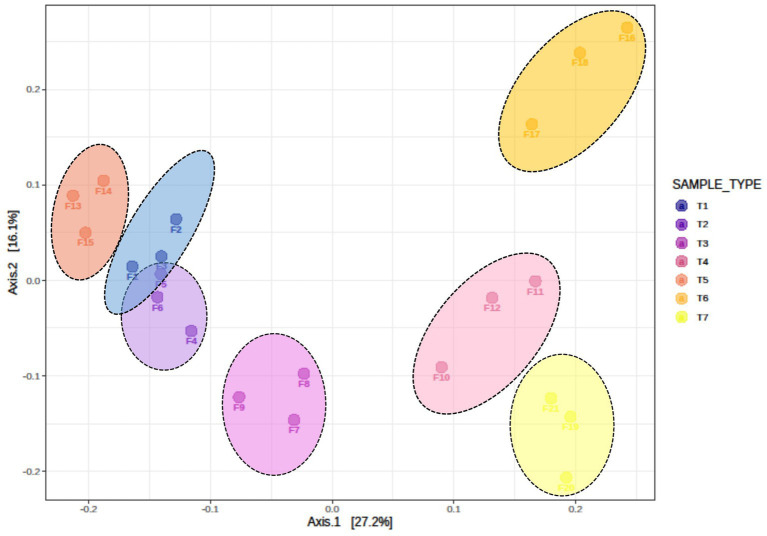
Figure 3.
Beta diversity, as illustrated by principal coordinate analysis (PCoA) based on the Bray–Curtis dissimilarity index, indicates significant differences in fungus composition among different treatments of conservation agriculture-based production systems (ANOSIM R = 0.70909, p < 0.001). T1-First treatment, T2-Second treatment, T3-Third treatment, T4-Fourth treatment, T5-Fifth treatment, T6-Sixth treatment, T7-Seventh treatment.

