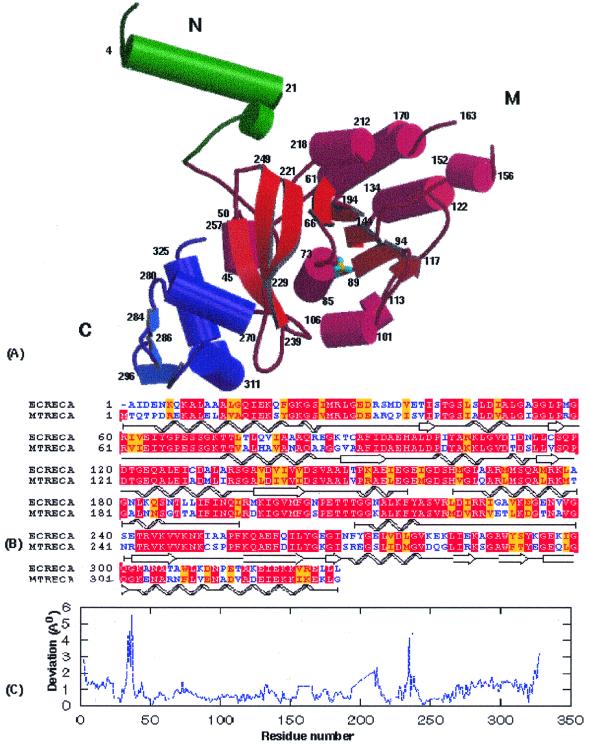
Figure 1.
Overall structure of MtRecA and its comparison with EcRecA. (A) A schematic representation using MOLSCRIPT (53) and Raster3D (54) of the crystal structure of MtRecA. N, M and C shown in green, red and blue, respectively, refer to the three domains. Phosphate groups are shown in ball and stick representation. α-Helices are represented by cylinders. β-Strands are represented by arrows and shown in a lighter shade in each domain as compared to the α-helices. (B) Pairwise sequence alignment (55,56) of EcRecA and MtRecA. The figure was prepared using BOXSHADE (57), showing identical regions highlighted on a red background, while regions with conservative substitutions are highlighted in yellow. Schematic depiction of secondary structural elements (showing spirals for helices and arrows for β-strands) were incorporated into the alignment. (C) Deviations in Cα positions of the MtRecA structure upon superposition on the EcRecA structure. This plot was prepared using GNUPLOT (58).

