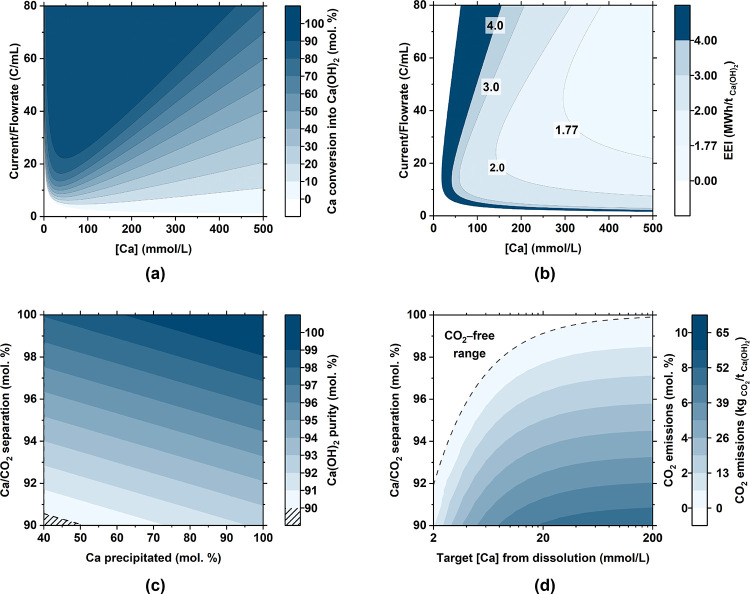
Figure 7.
Electrolyzer performance for a Faradaic efficiency of 90% and a cell voltage of −2.06 V showing (a) Ca conversion (into Ca(OH)2) and (b) the electric energy intensity (EEI) of Ca(OH)2 precipitation. Both parts a and b refer to Ca(OH)2 precipitation (Step 3) only and are shown as a function of the inlet Ca concentration and the current/flow rate ratio. (c) Purity of portlandite produced as a function of the Ca/CO2 separation in solution after Step 2a-i. (d) Extent of CO2 degassing (as a percent of the amount of CO2 introduced into the system via the dissolution of limestone) that could occur as a function of the initial EDTA concentration and extent of Ca/CO2 separation after Step 2a-i.

