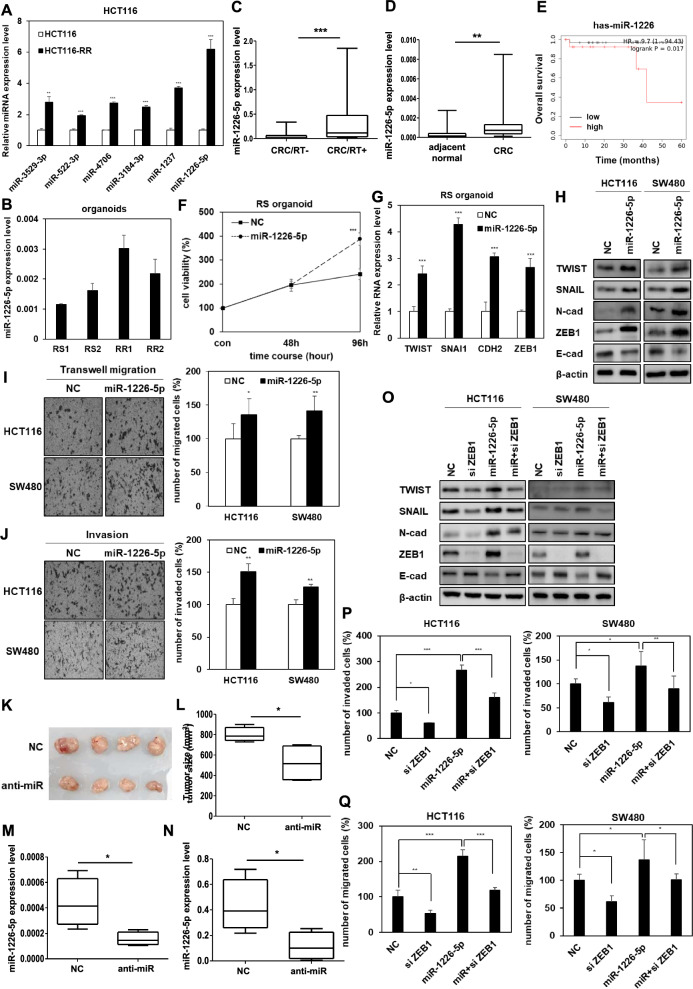
Fig. 1.
miR-1226-5p promotes tumor progression by upregulating ZEB1 in radioresistant CRC cells HCT116 and SW480. A Six miRNAs (miR-3529-3p, miR-522-3p, miR-4706, miR-3184-3p, miR-1237, and miR-1226-5p) were selected based on miRNA sequencing data from the GEO series GSE159528. The expression of six miRNAs was measured by qRT-PCR in HCT116 and HCT116-RR cells. B The levels of miR-1226-5p were determined in radioresistant or radiosensitive patient-derived organoids. (RS; radiosensitivity; RR; radioresistance). C Levels of miR-1226-5p were measured in plasma of CRC patients with or without radiotherapy (CRC/RT-, n = 37; CRC/RT + , n = 37). qRT-PCR was normalized to U6. D The levels of miR-1226-5p were measured in adjacent normal and tumor tissues of CRC patients (adjacent normal, n = 39; tumor, n = 40). E Kaplan–Meier overall survival curve of stage II rectal adenocarcinoma patients according to the expression level of miR-1226-5p. F, G Radiosensitive CRC patient-derived organoids were transfected with negative control (NC) or miR-1226-5p. F Cell viability was measured overexpression of miR-1226-5p in radiosensitive organoids derived from CRC patients by MTT assay. G TWIST, SNAIL, CDH2, and ZEB1 mRNA expression levels were measured by qRT-PCR. qRT-PCR was normalized to GAPDH. H-J HCT116 and SW480 cells were transfected with negative control (NC) or miR-1226-5p mimic. H Expression of TWIST, SNAIL, N-cadherin, ZEB1, and E-cadherin in the indicated cells was confirmed through Western blot analysis. β-Actin was used for normalization in Western blot analysis. Transwell migration (I), and matrigel coated invasion assays (J) were subjected on the designated cells. K-N HCT116 RR cells overexpressing the negative control (NC) or the miR-1226-5p inhibitor (anti-miR-1226-5p) were subcutaneously injected into the flank of Balb/c nude mice (n = 4; 1 × 10⁷ cells/mouse). Whole tumor images (K) and tumor size (L) of negative control (NC) and miR-1226-5p inhibitor (anti-miR-1226-5p) overexpressed mice are shown. Scale bar is 1 cm. The expression of miR-1226-5p in tumor tissue (M) and plasma (N) of mice was analyzed by qRT-PCR. qRT-PCR was normalized to U6. O–Q To elucidate the tumorigenicity mechanism of miR-1226-5p, HCT116 and SW480 cells were transfected with siRNA against ZEB1 or miR-1226-5p alone or together. O Expression of TWIST, SNAIL, N-cadherin, ZEB1, and E-cadherin was confirmed by Western blot analysis in the indicated cells. β-Actin was used for normalization in Western blot analysis. Transwell migration (P) and matrigel-coated invasion assays (Q) were applied to HCT116 and SW480 cells. Scale bar 200um. The experiment was repeated with triplicates and representative Western blotting images are shown. The data are presented as the mean ± S.D. after triplicate. *P < 0.05; **P < 0.01; ***P < 0.001. Student’s t test, and One-way ANOVA followed by bonferroni comparison test

